Climate Quest
Group Project (8 weeks)
Tools: Adobe Illustrator, Procreate, Figma, SketchUp & Lumion.
Role: Graphic Designer for Logo, Posters, Wayfinding, Illustration,
3D-Mockup & Researcher
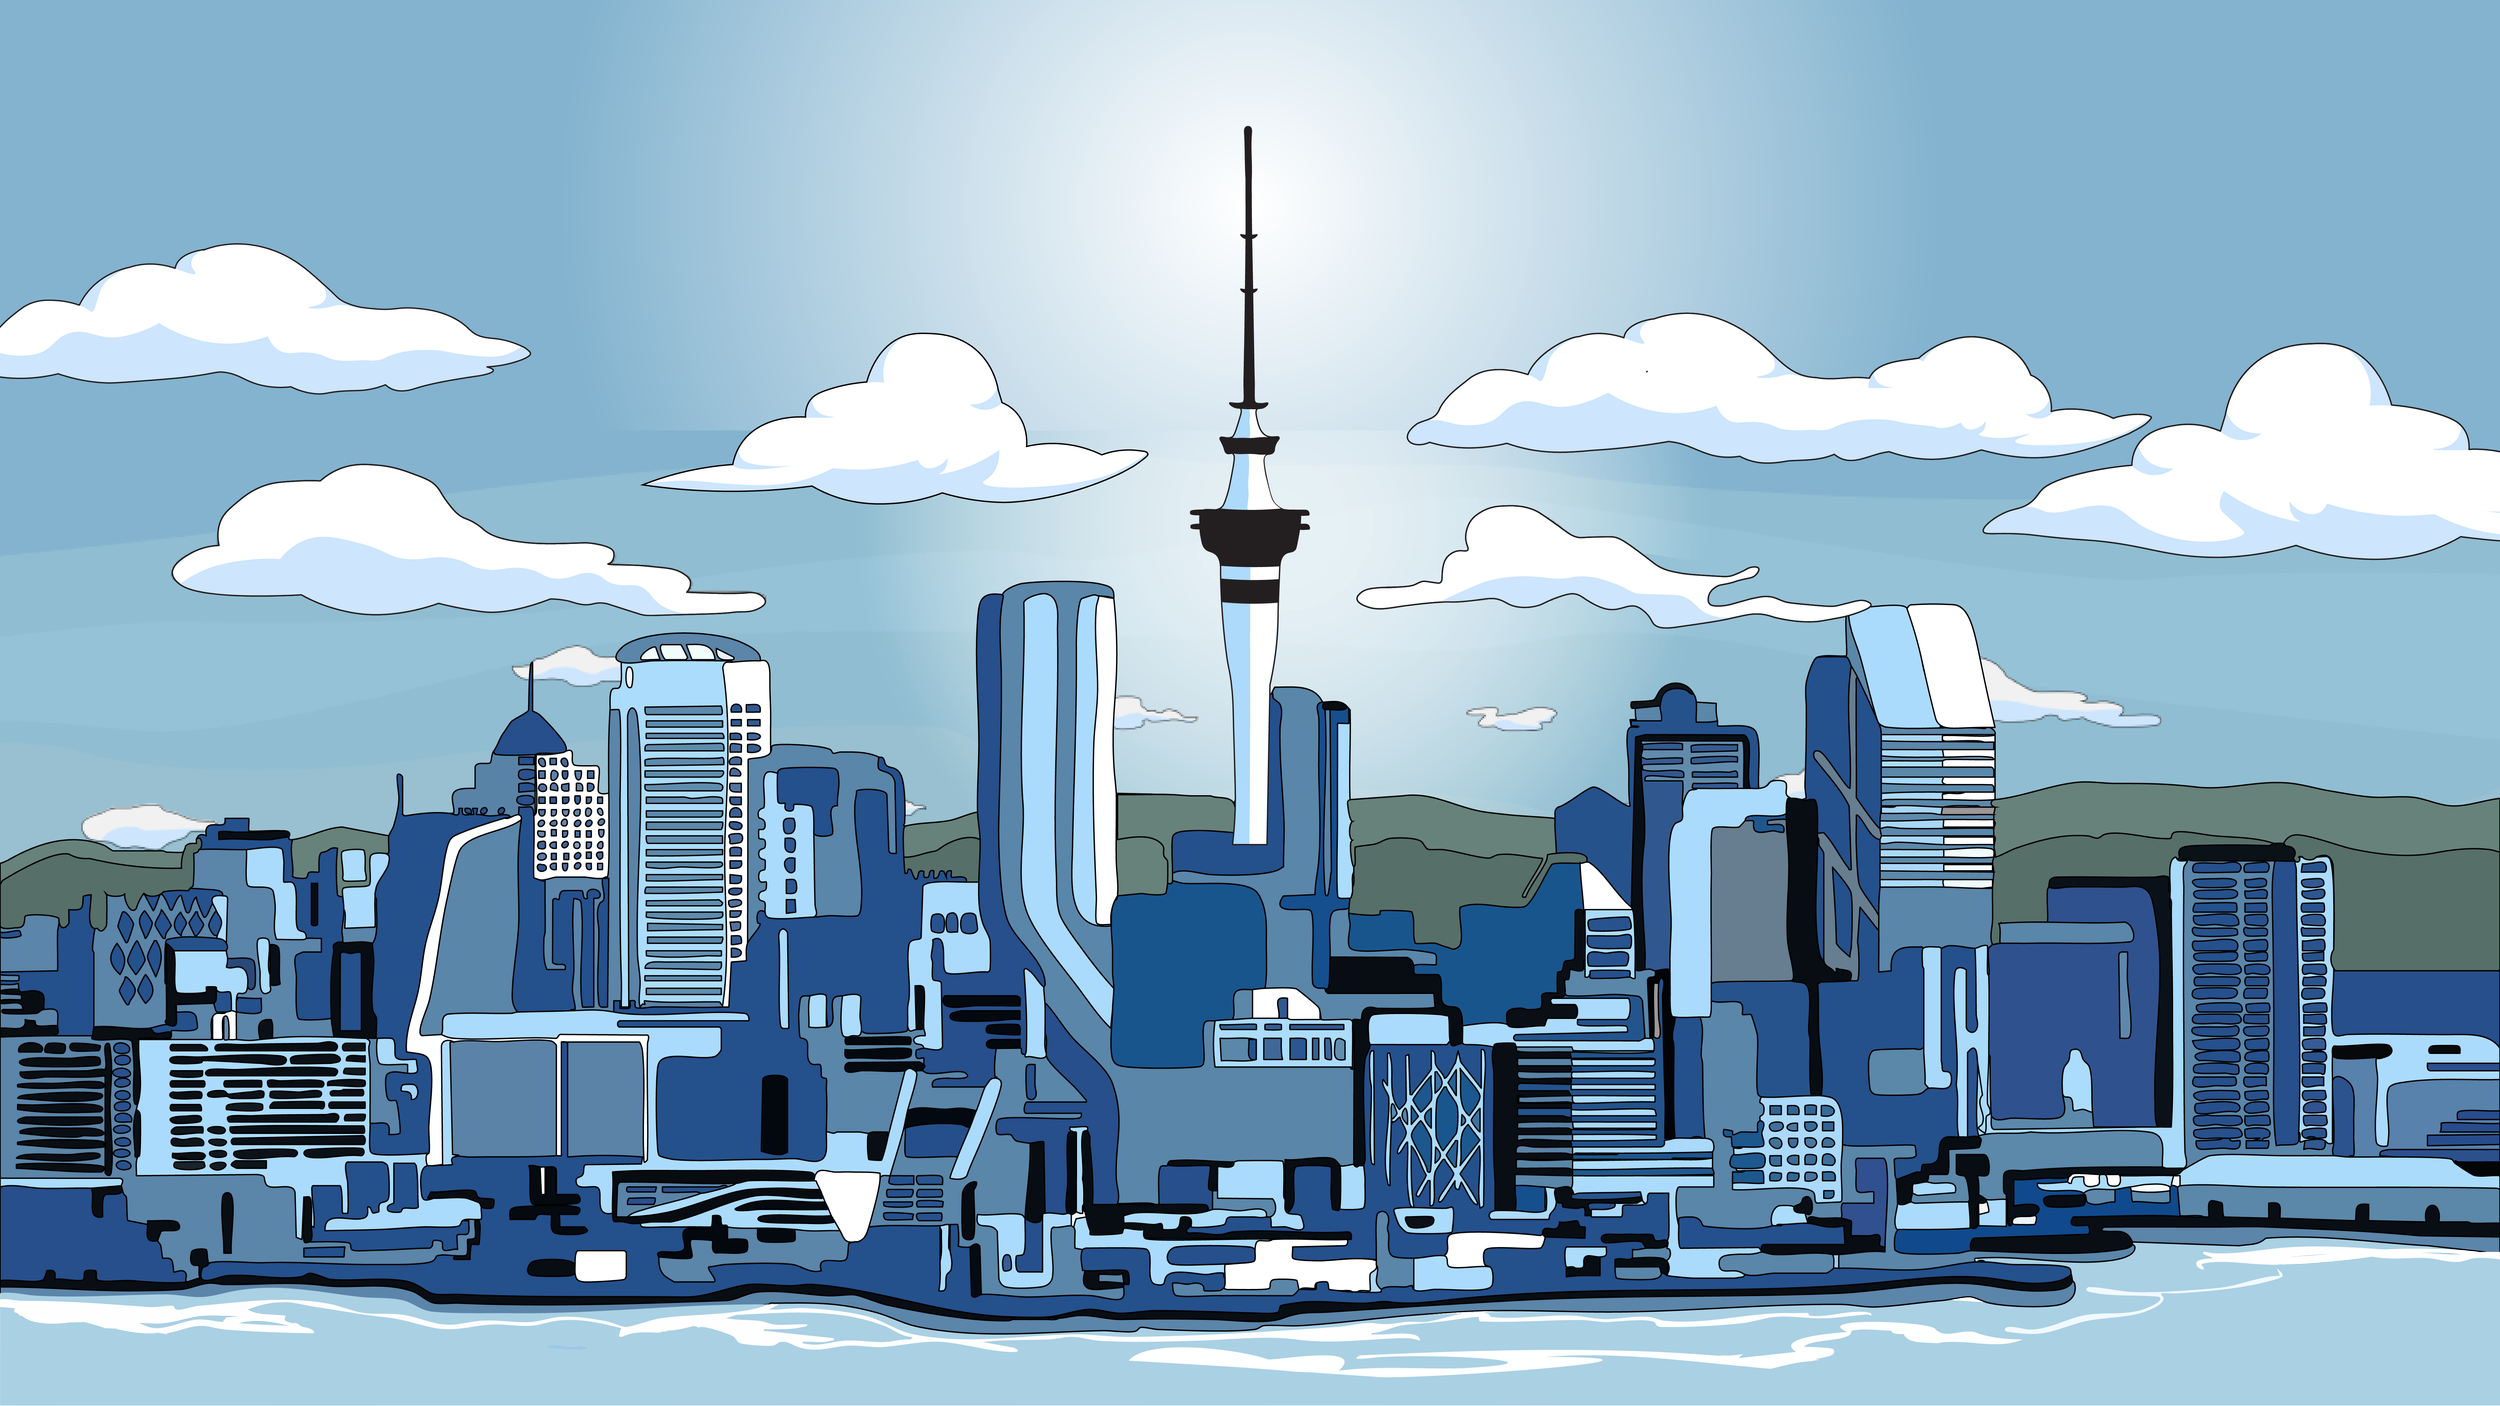
An interactive exhibition that transforms climate data into a tangible, emotional experience through an animation, games, and participatory elements. It engages audiences in reflection and collective action toward sustainability.
-
This exhibition, developed in response to Adobe's challenge, envisions a sustainable future for Aotearoa through immersive, interactive design. Centred on UN Sustainable Development Goal 13: Climate Action, it transforms abstract climate data into an emotional and participatory experience.
By placing Adobe's creative tools at its core, the exhibition empowers young urban Aucklanders to engage with climate issues and recognise their role in shaping a sustainable, inclusive, and connected future. -
Our target audience is young urban Aucklanders aged 18–25, a generation that is hyper-connected, creative, and deeply concerned about climate change. While they care about the crisis, many feel overwhelmed by its scale and complexity.
With over 260,000 young adults aged 15–29 in the Auckland region, this is a significant and engaged demographic, active across gaming, social media, and online activism. To reach them, the exhibition speaks their language: interactive, visual, immersive, and emotionally resonant. -
How might we turn climate data into a visceral, immersive journey that empowers individuals by visualising the collective power of their choices?
-
An interactive exhibition that transforms climate data into a tangible, emotional experience through animation, games, and participatory elements. It engages audiences in reflection and collective action toward sustainability.
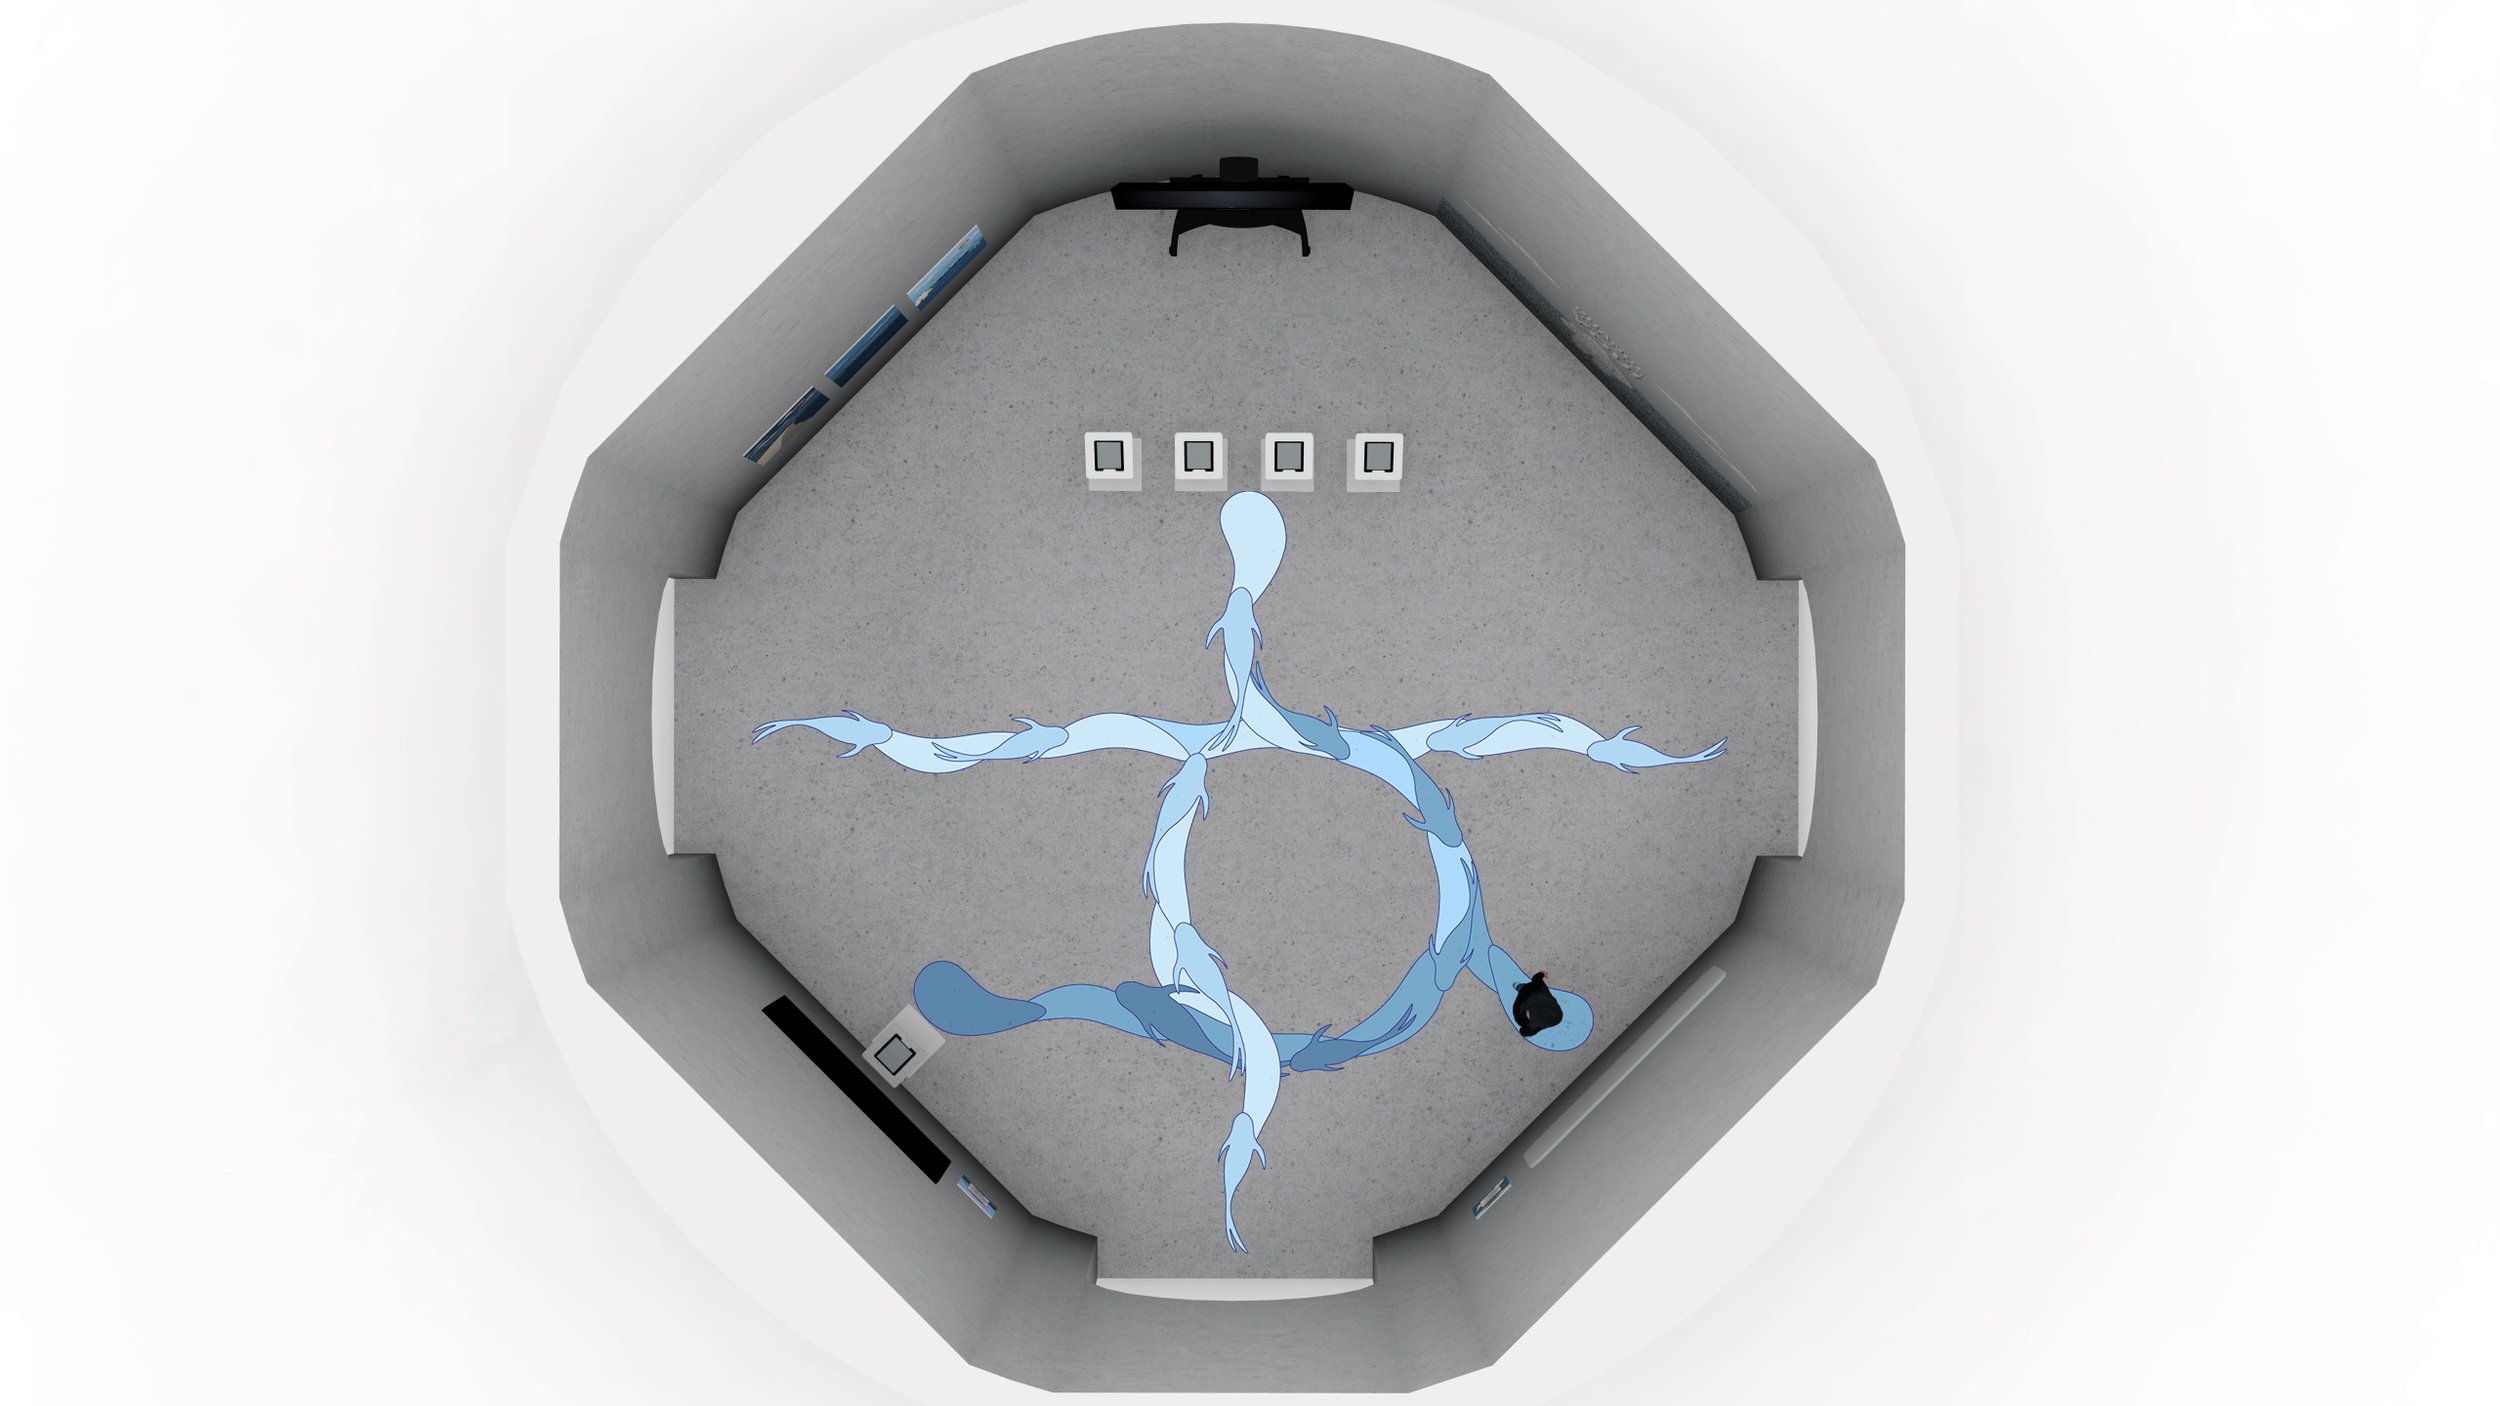
This is the exhibition floor plan showing a colour-coded wayfinding system that accommodates three entrances. Each entrance is assigned a distinct colour, guiding visitors to the first station. From there, subsequent colours lead visitors through the next stations.
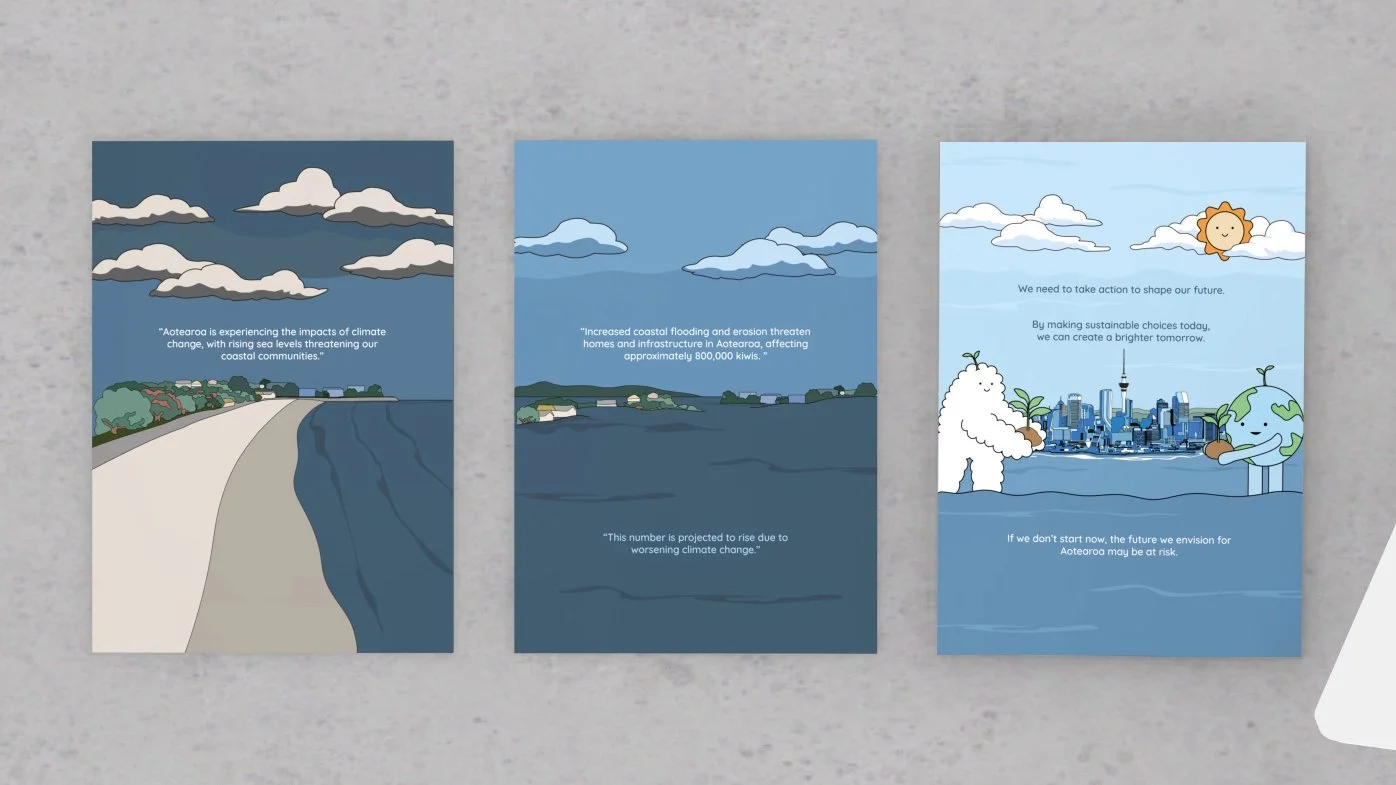
Infographic Posters
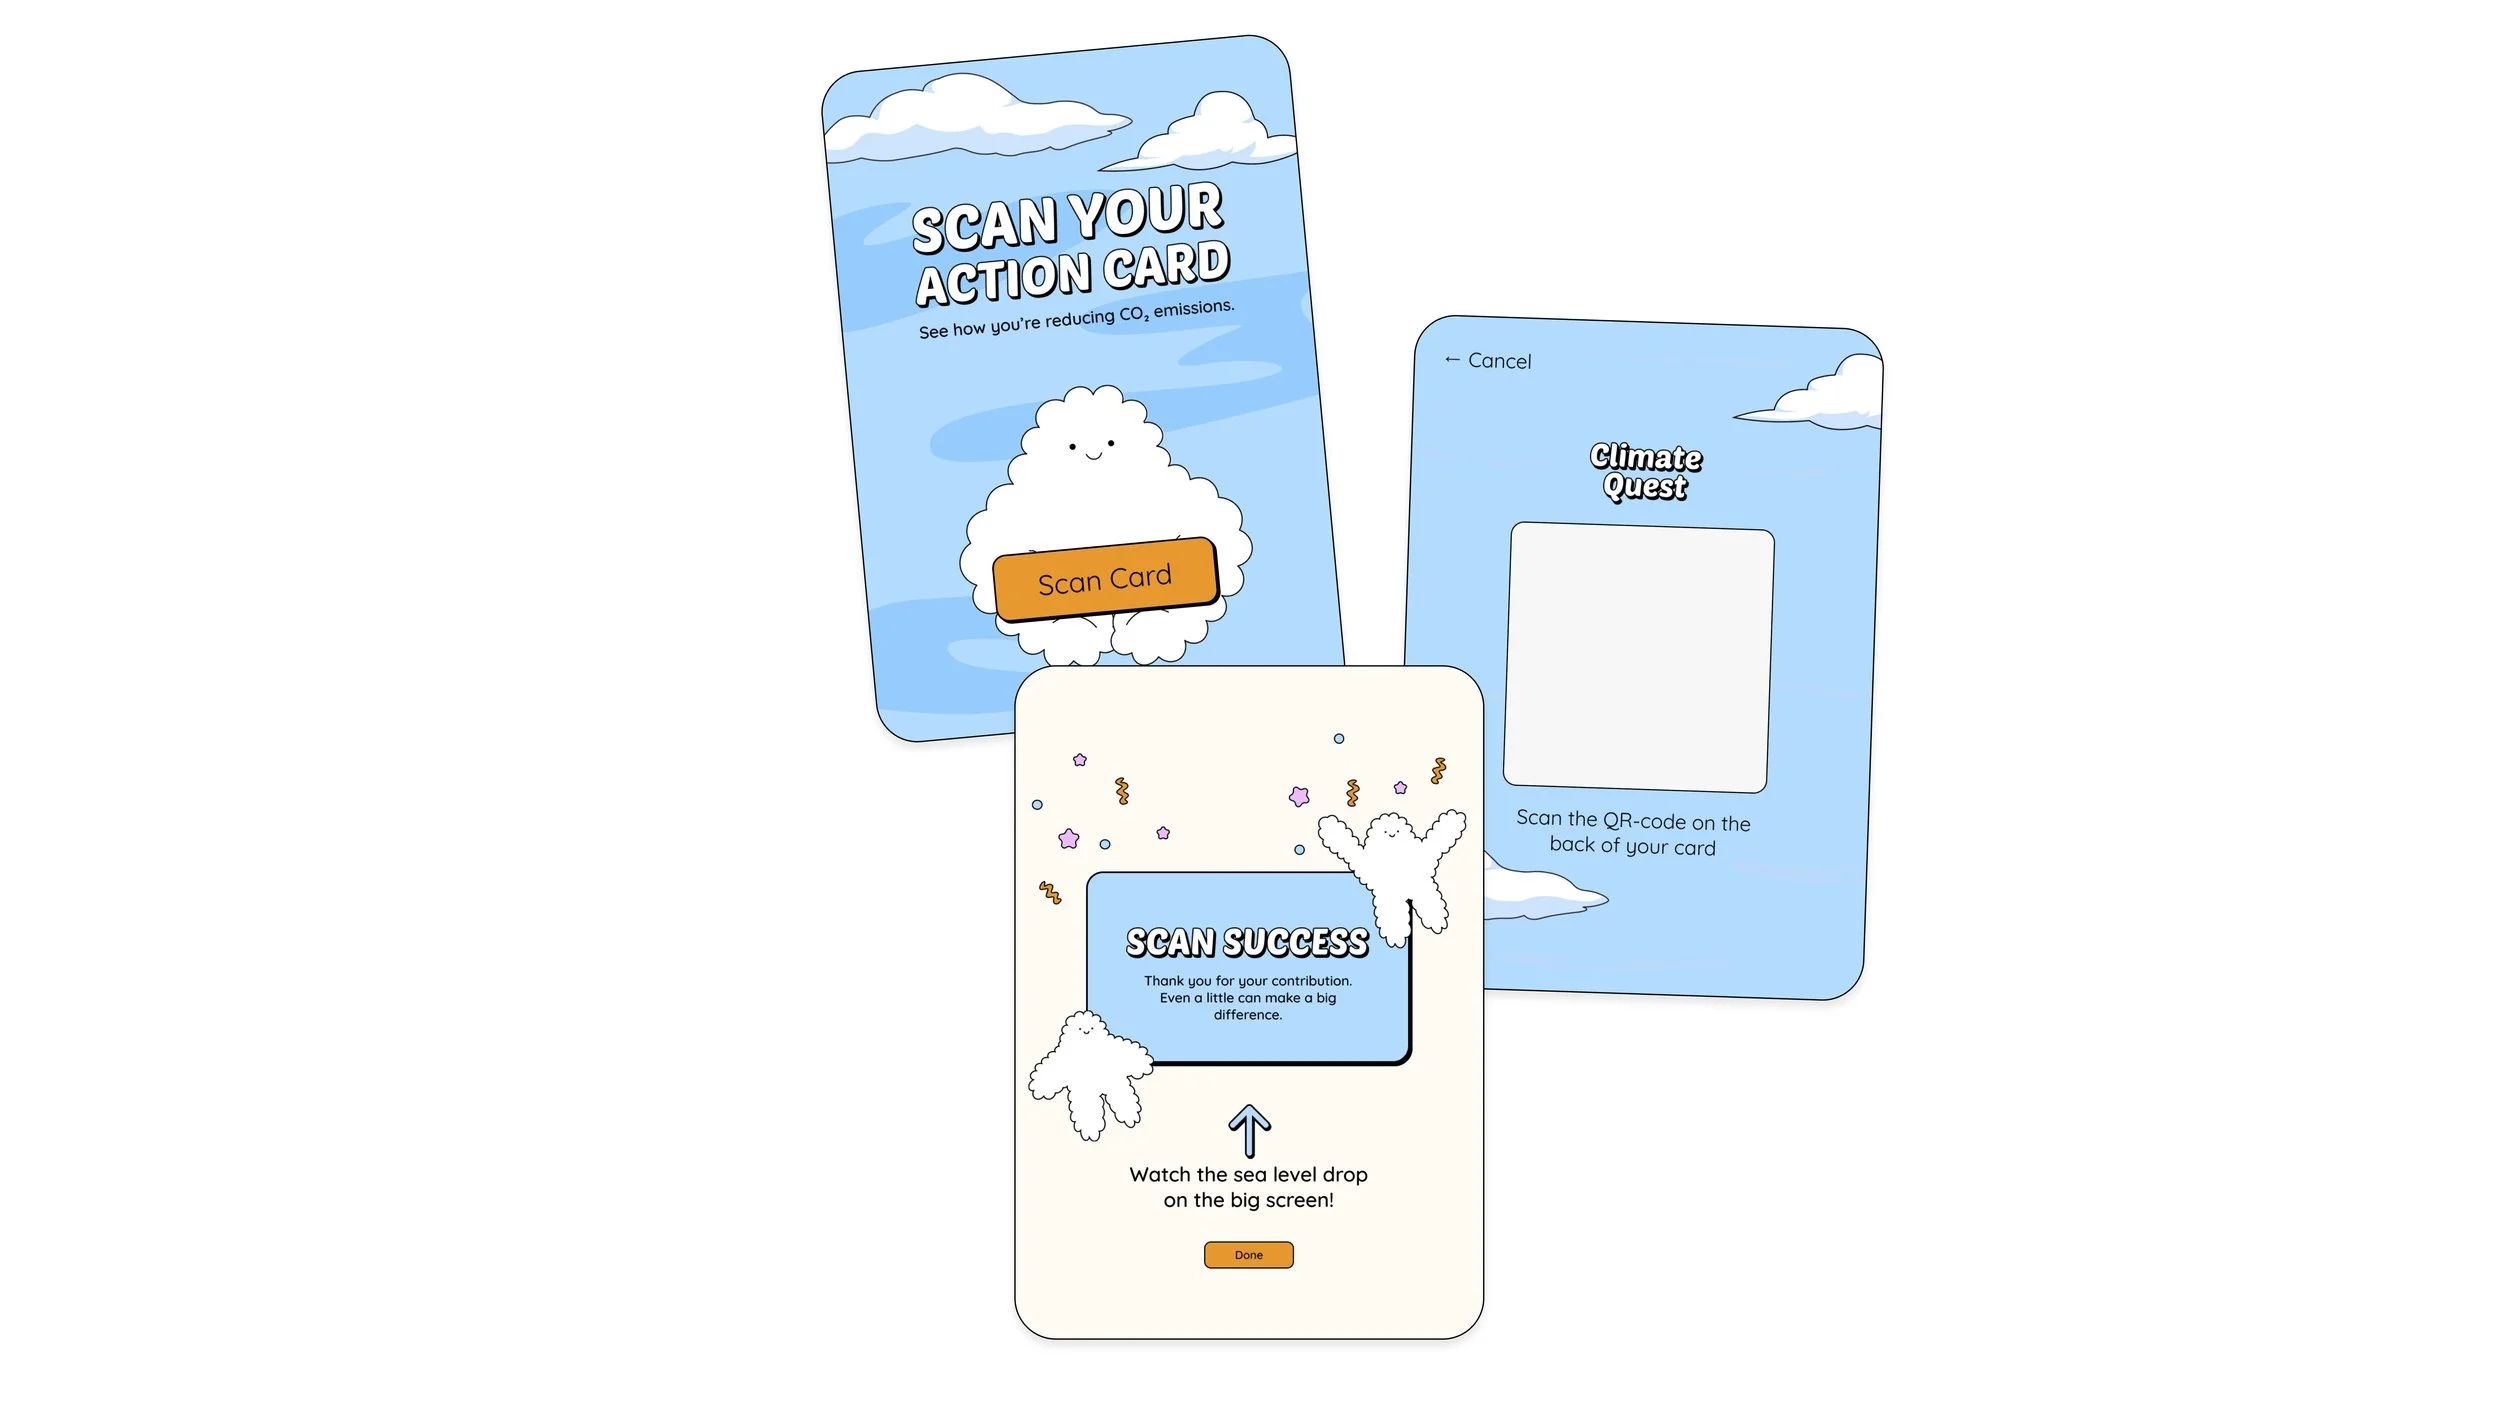
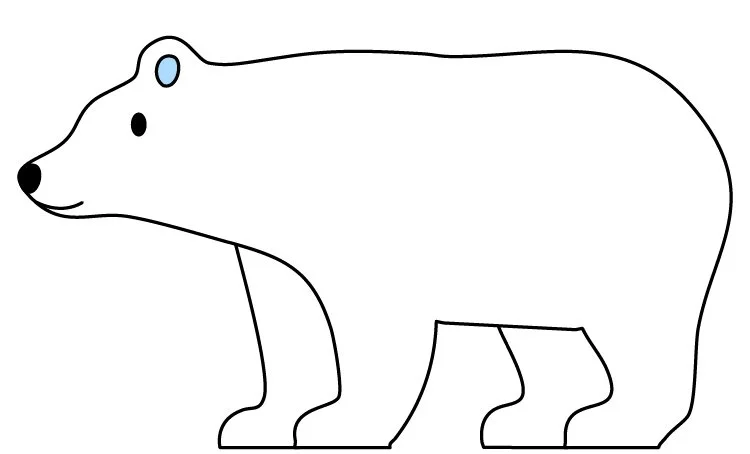
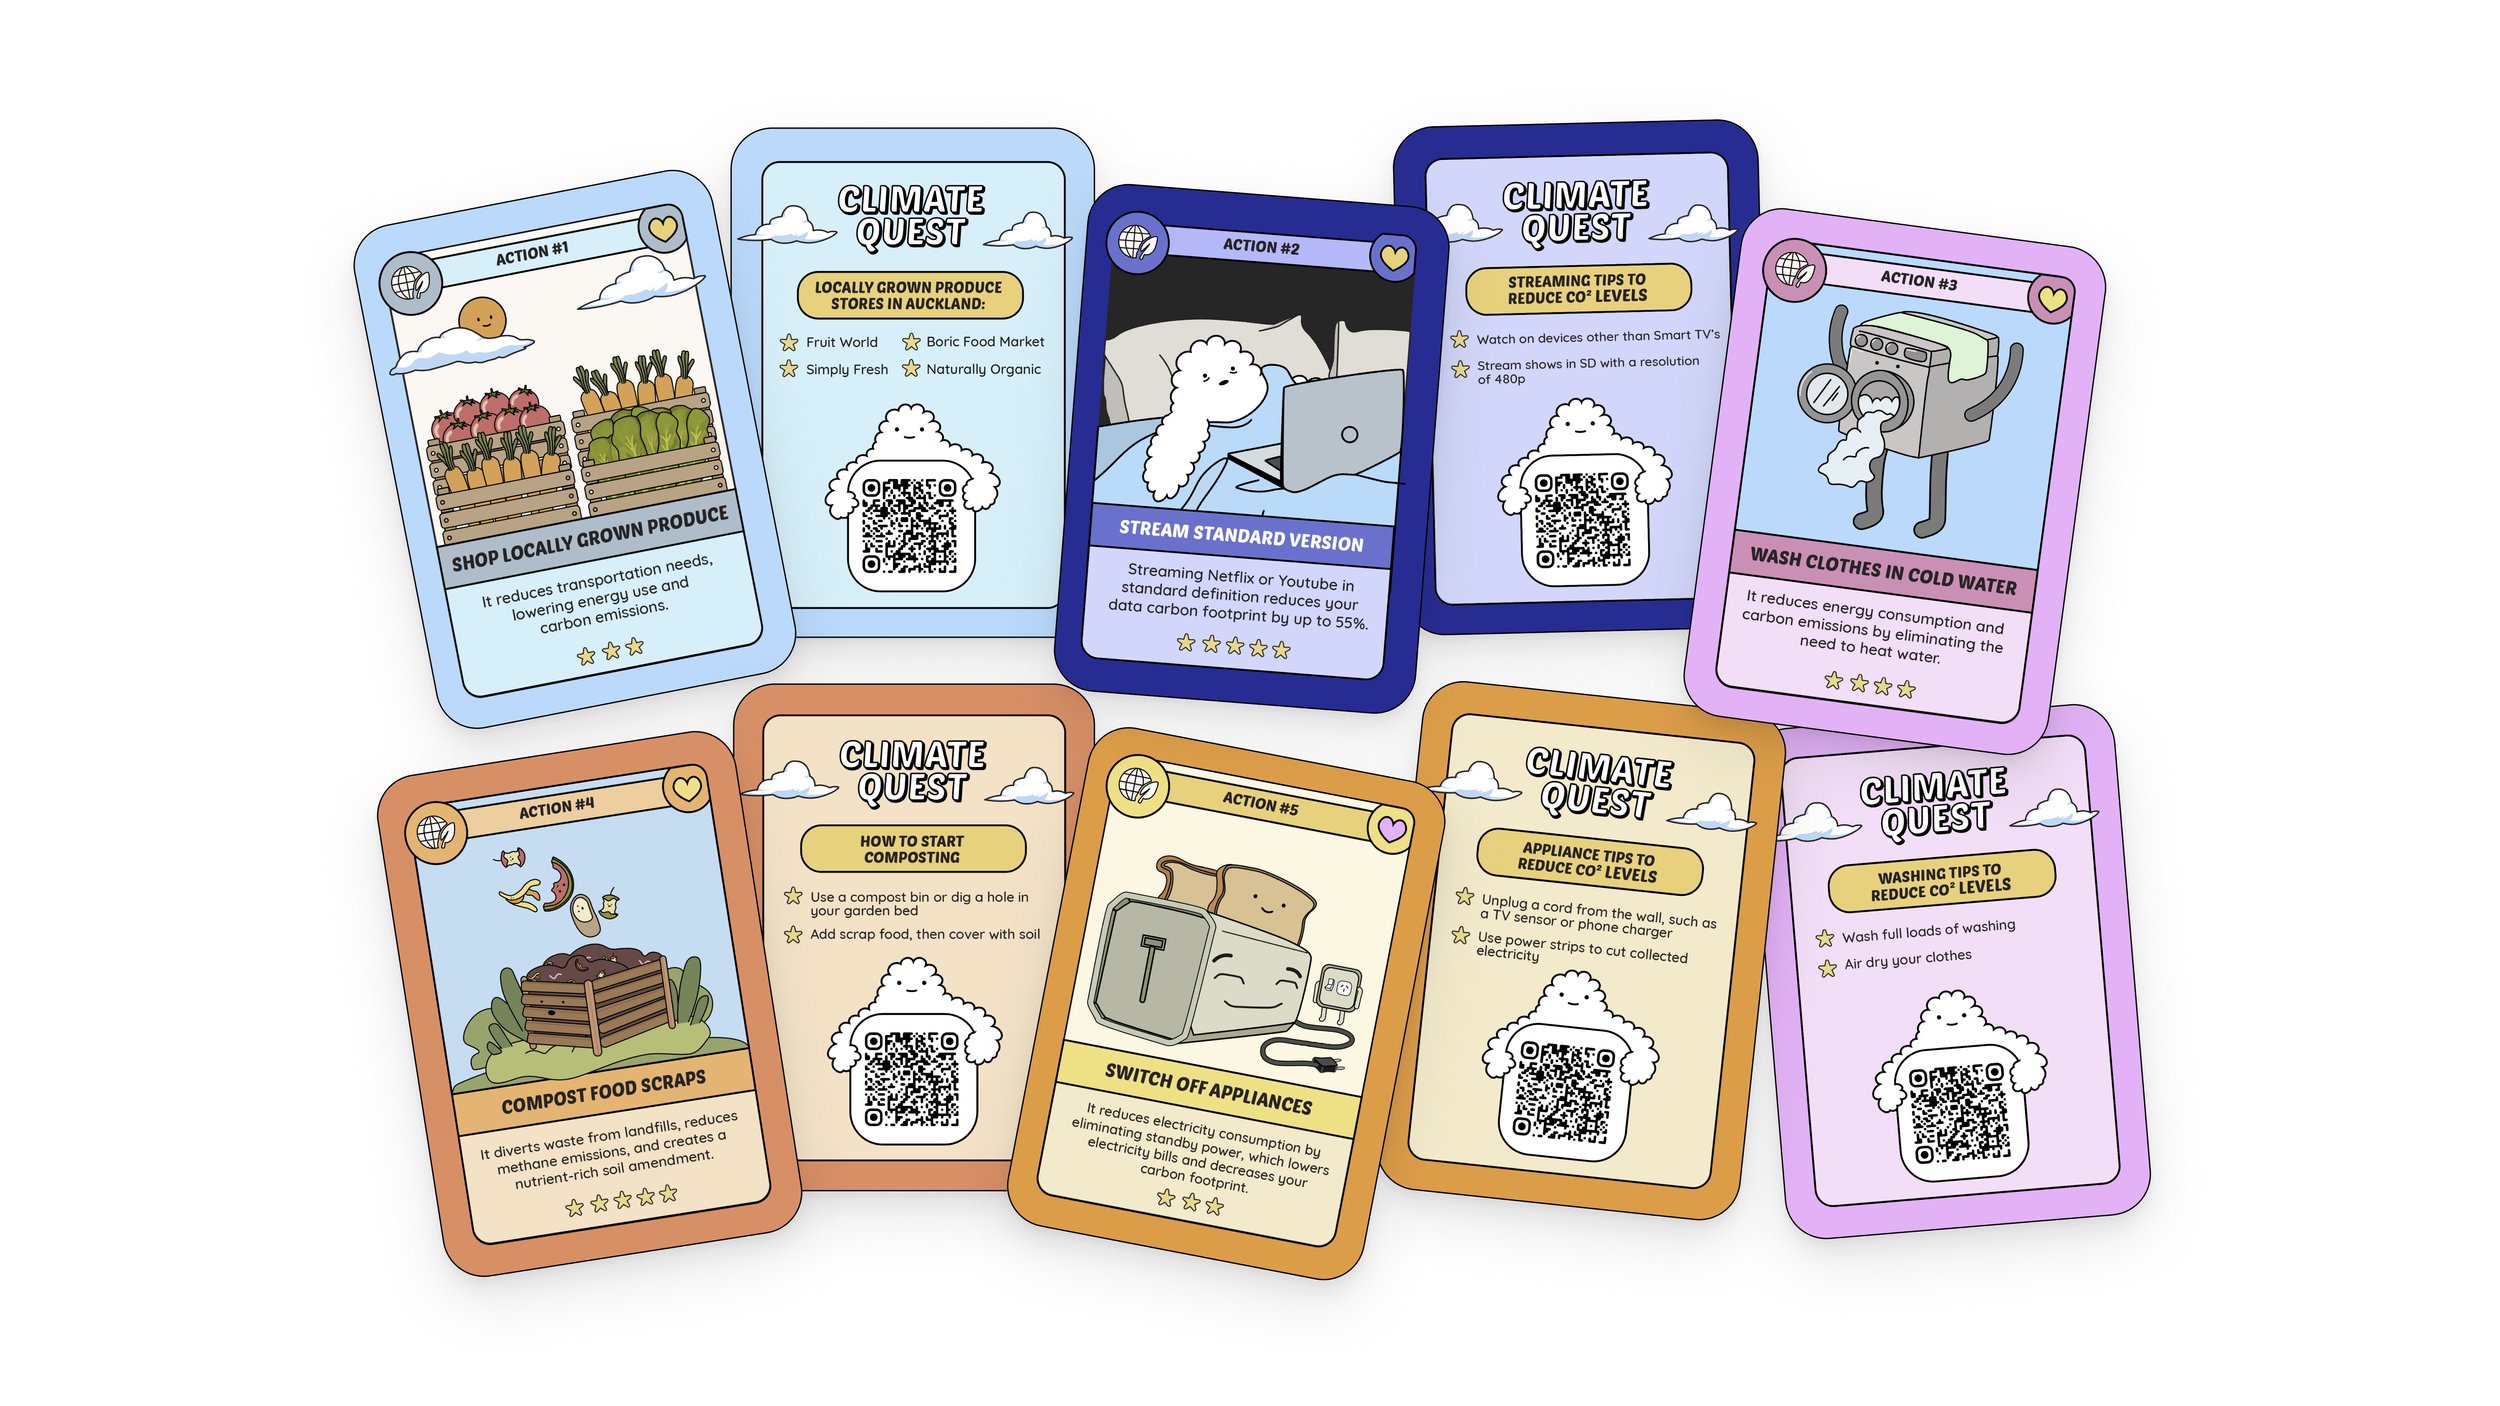
Cards designed by the other graphic designer, Jess.
The iteration process :
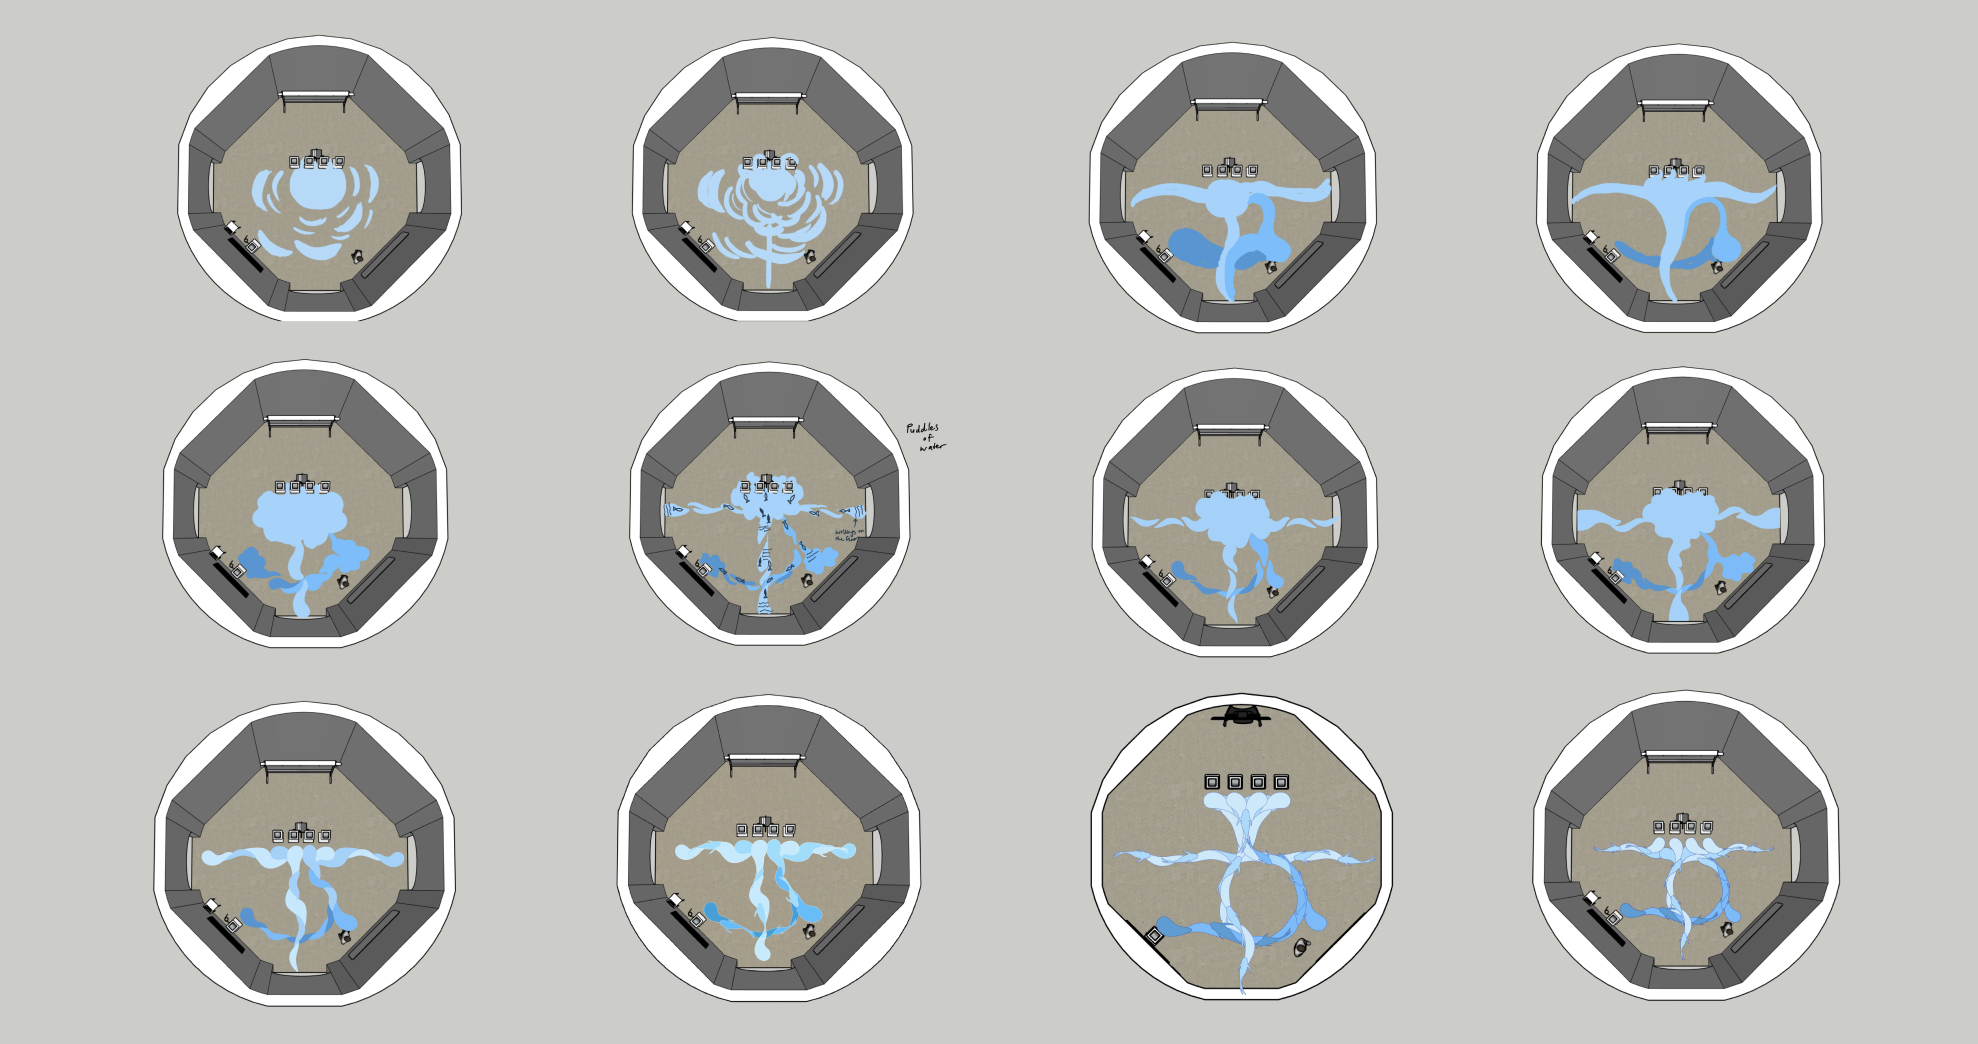
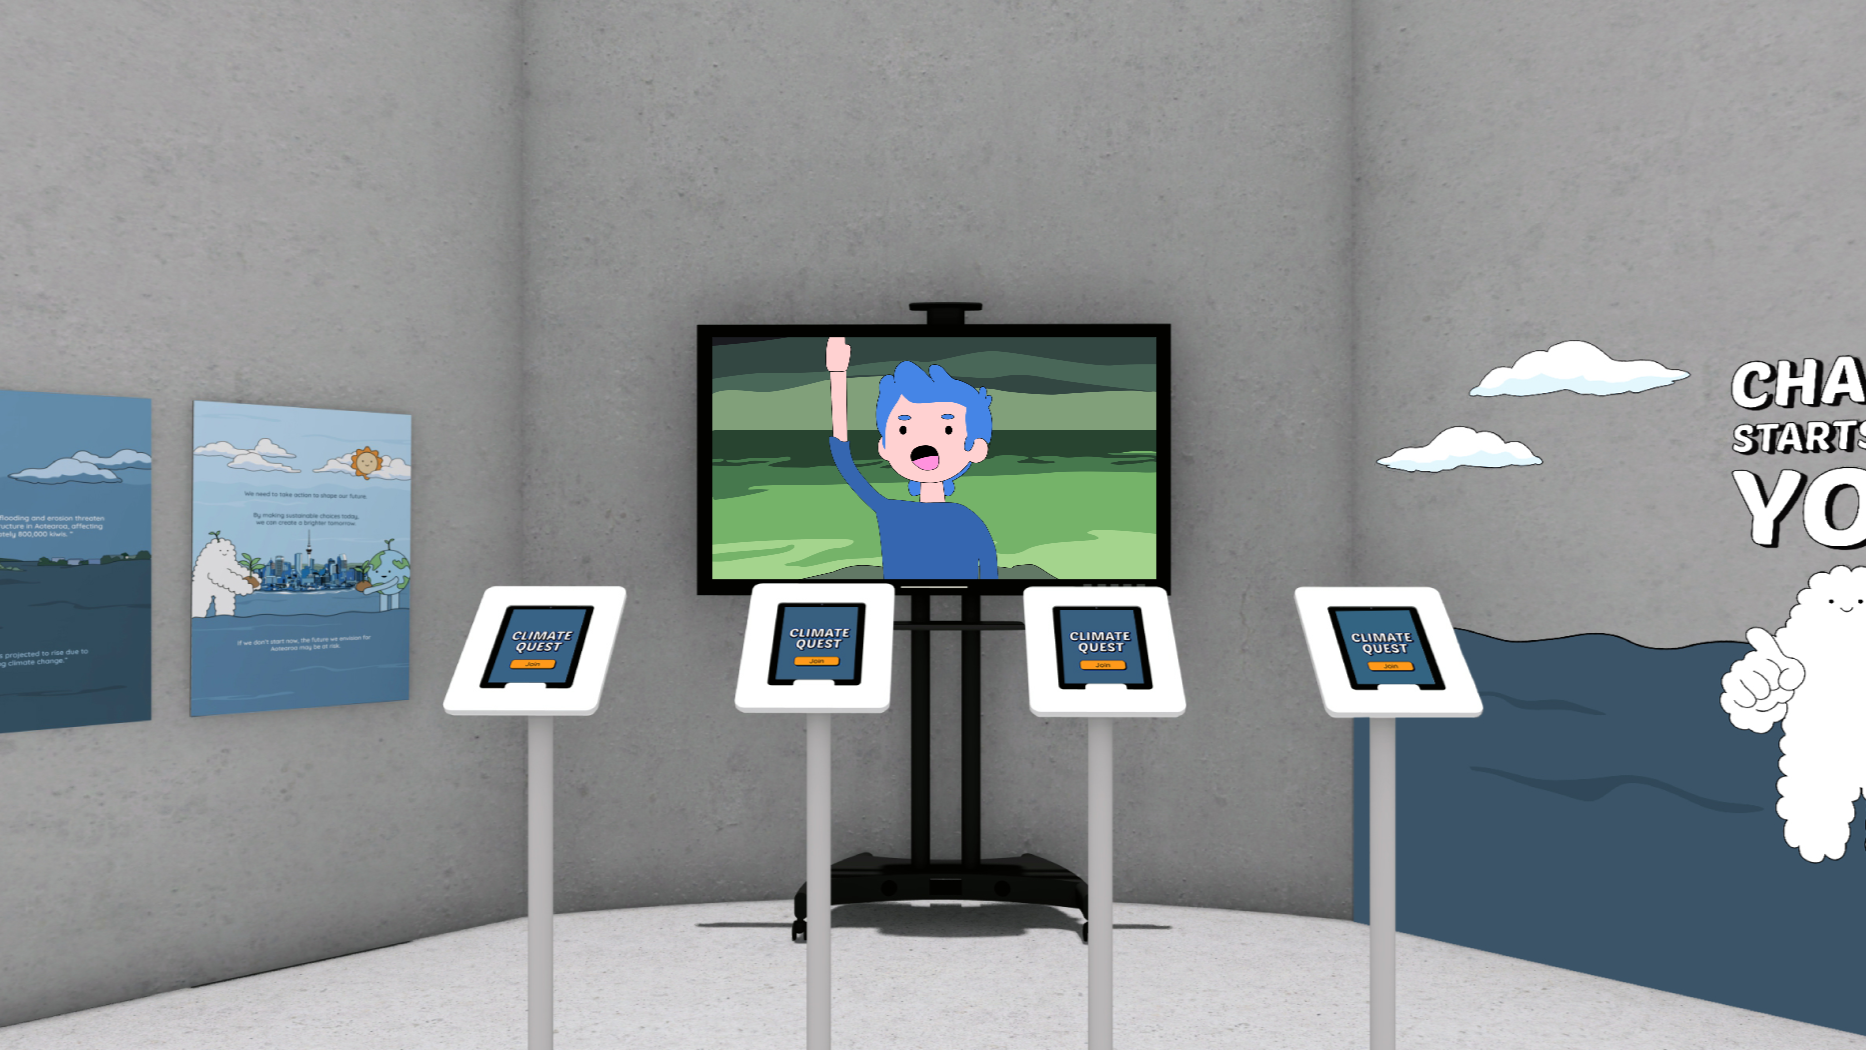
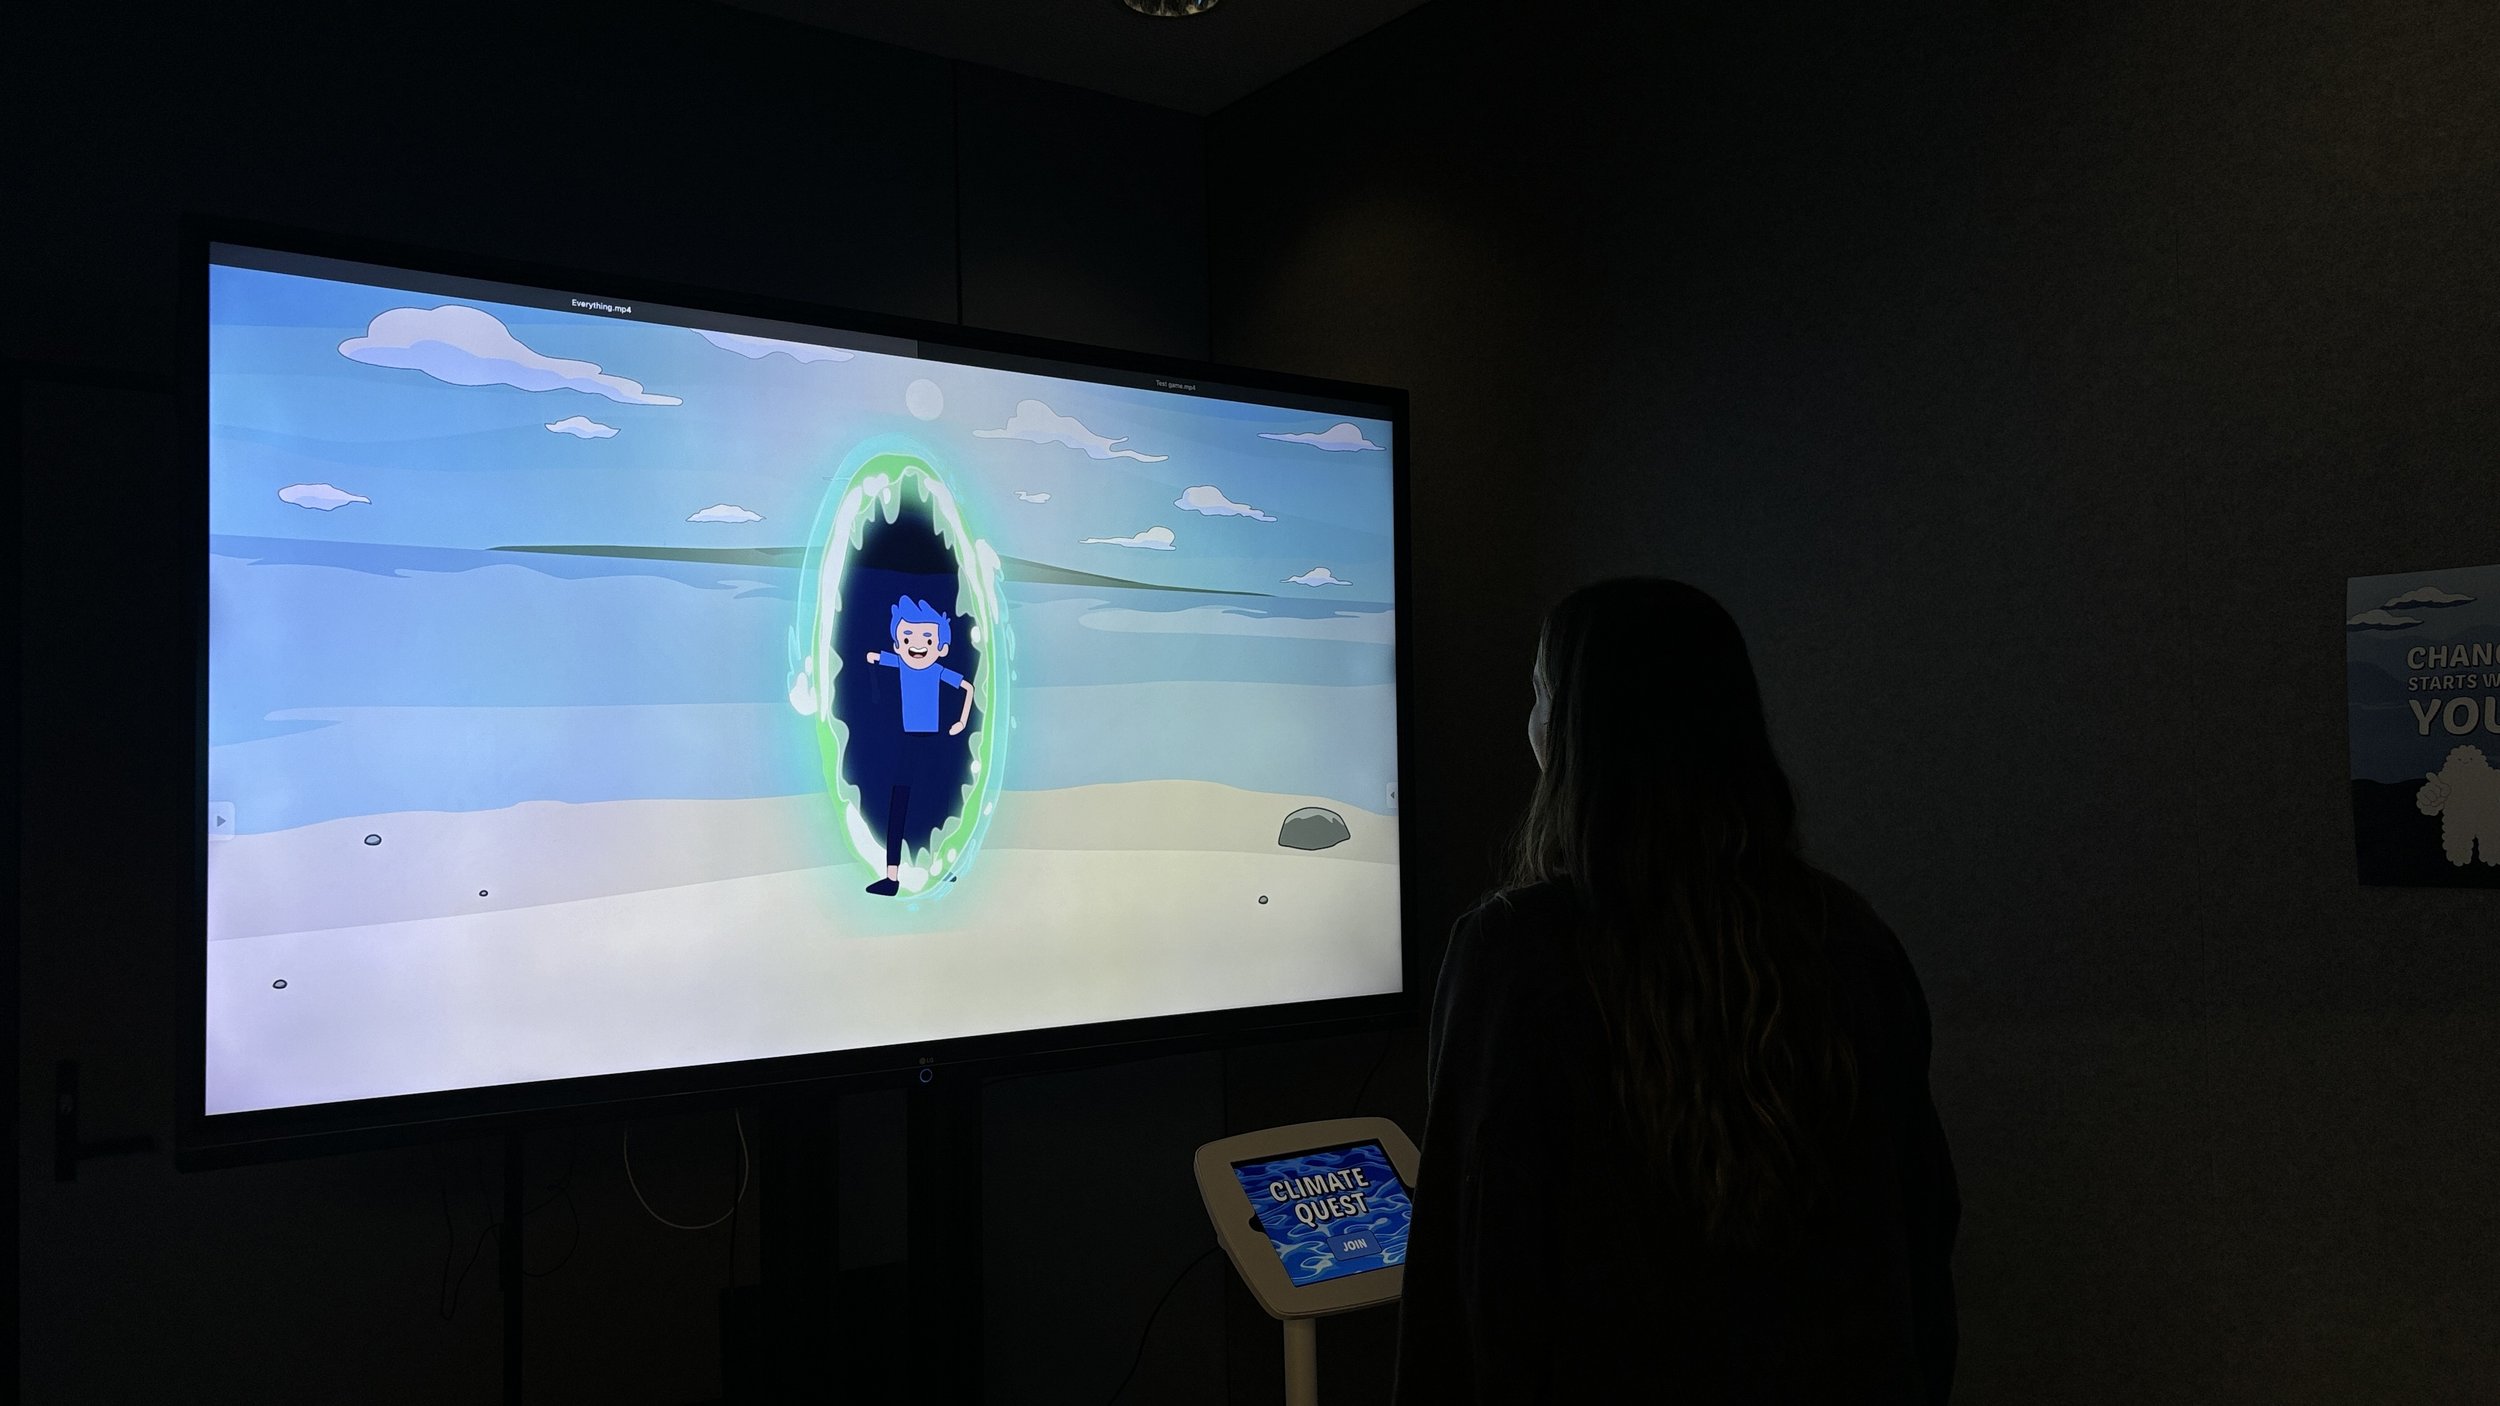
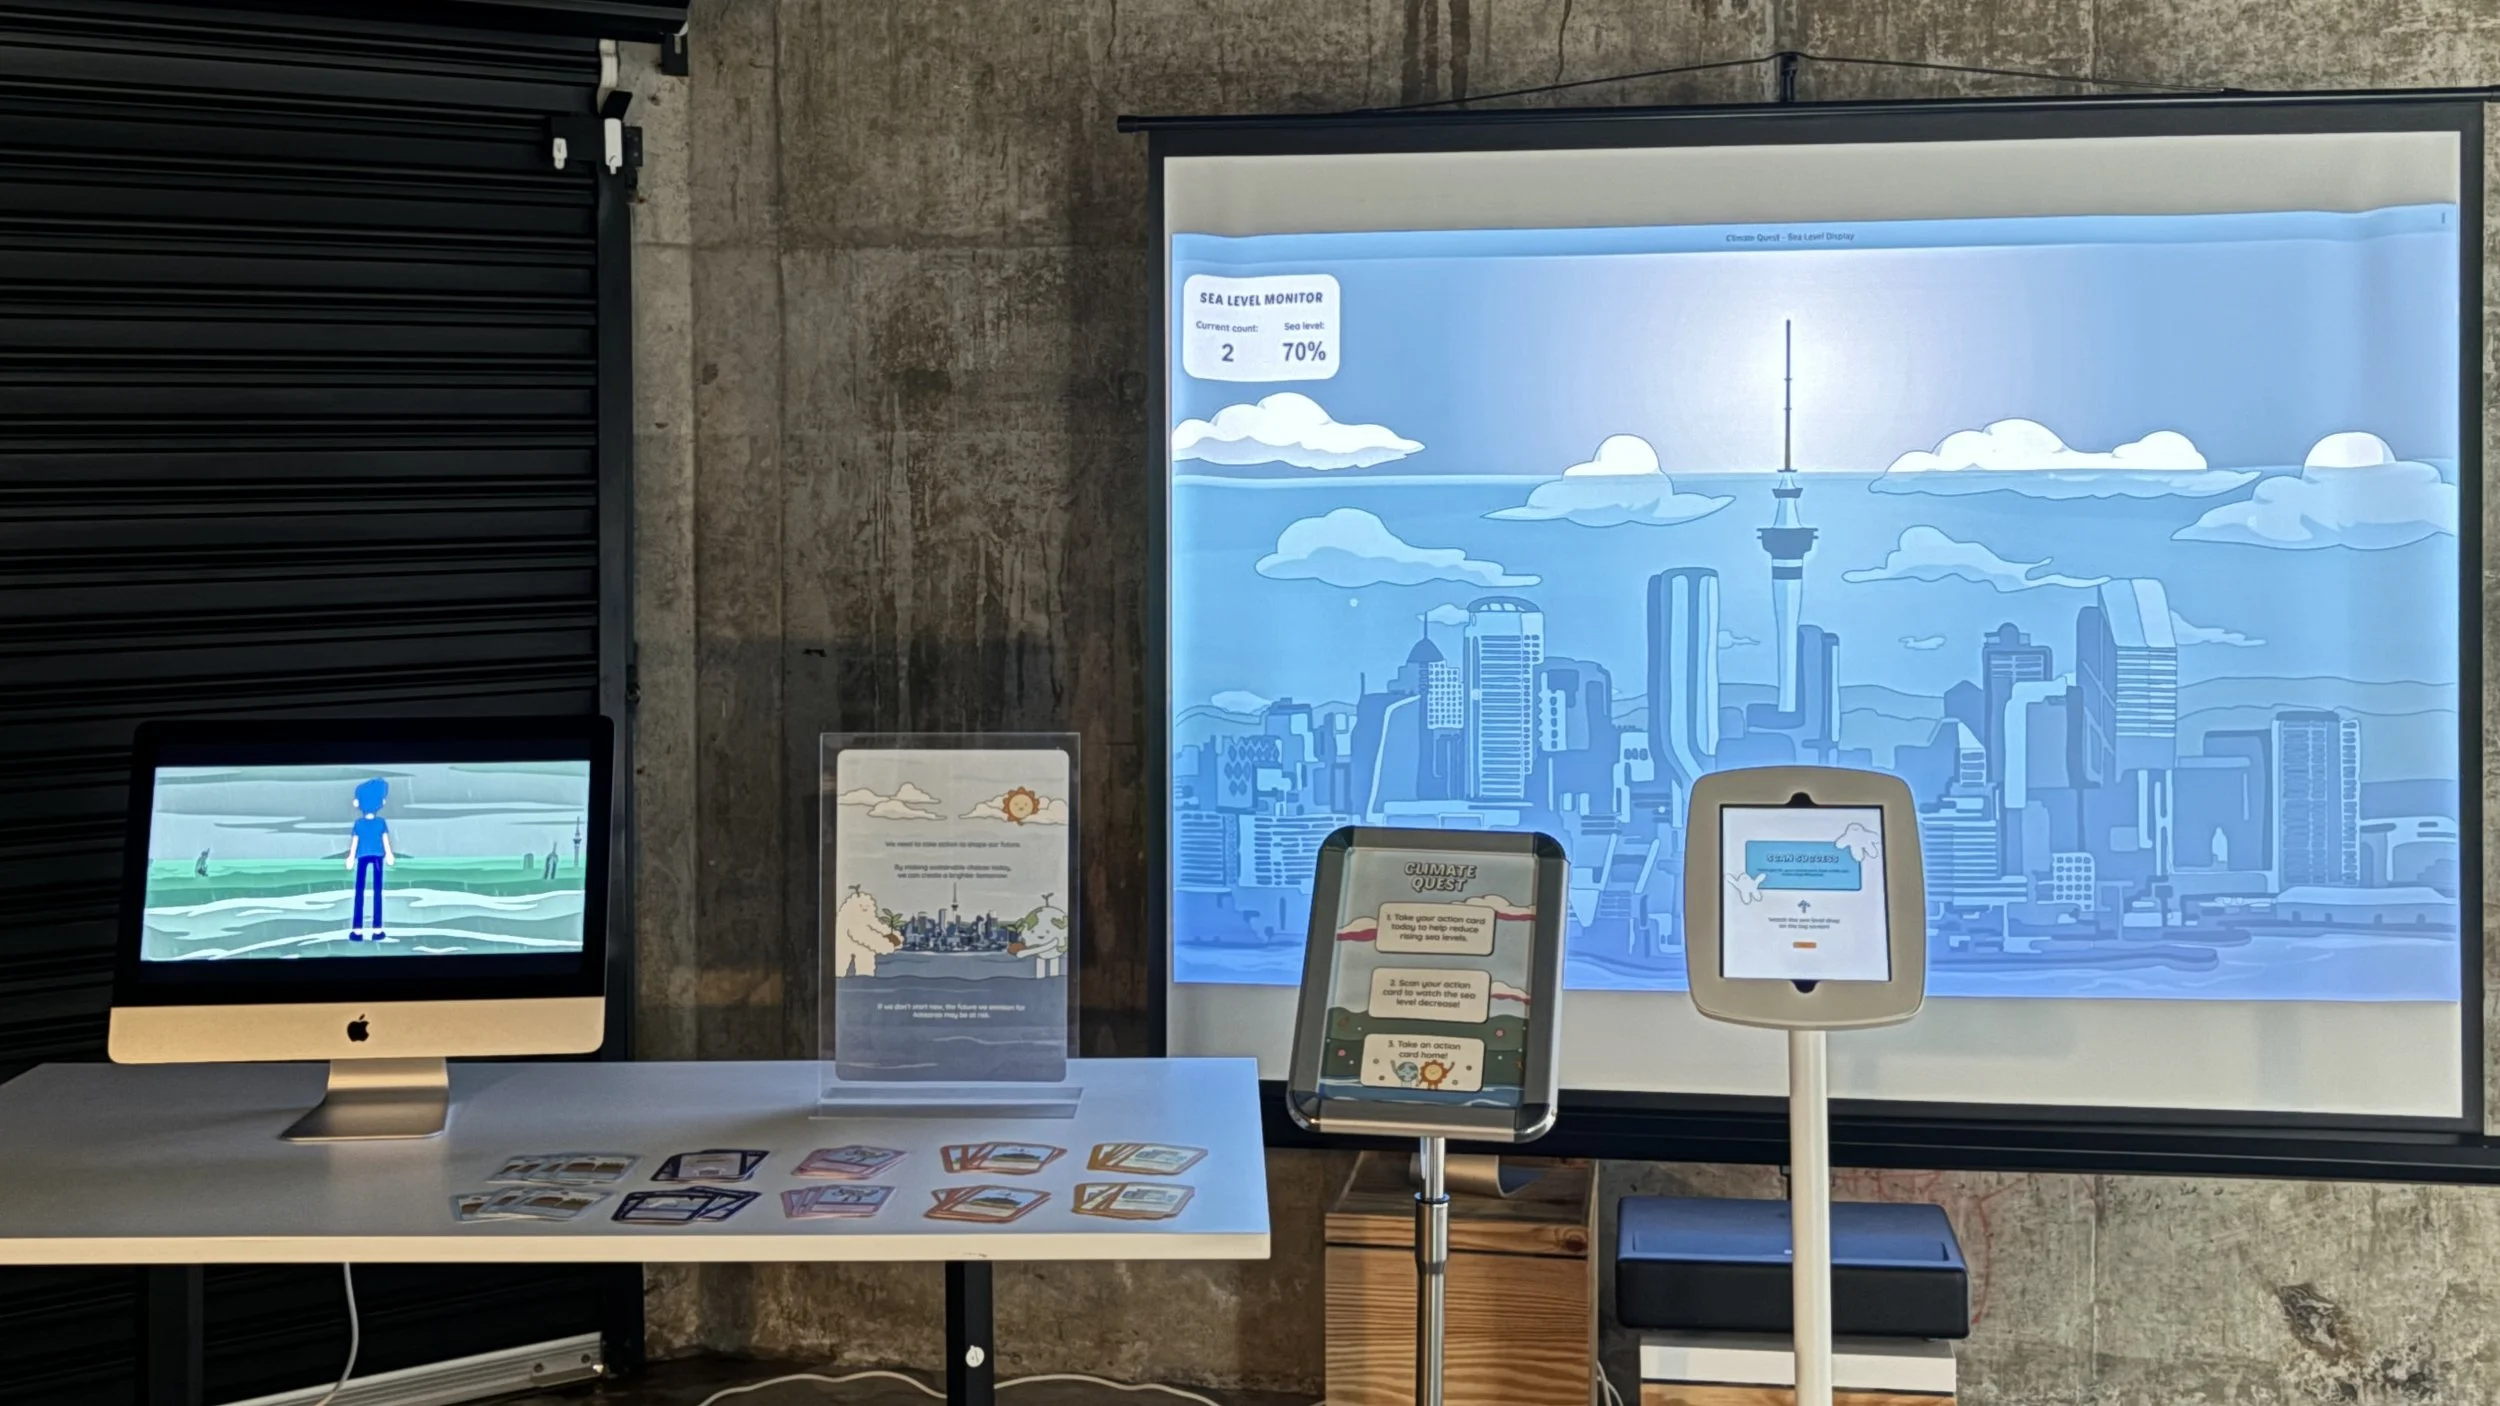
The animation and game
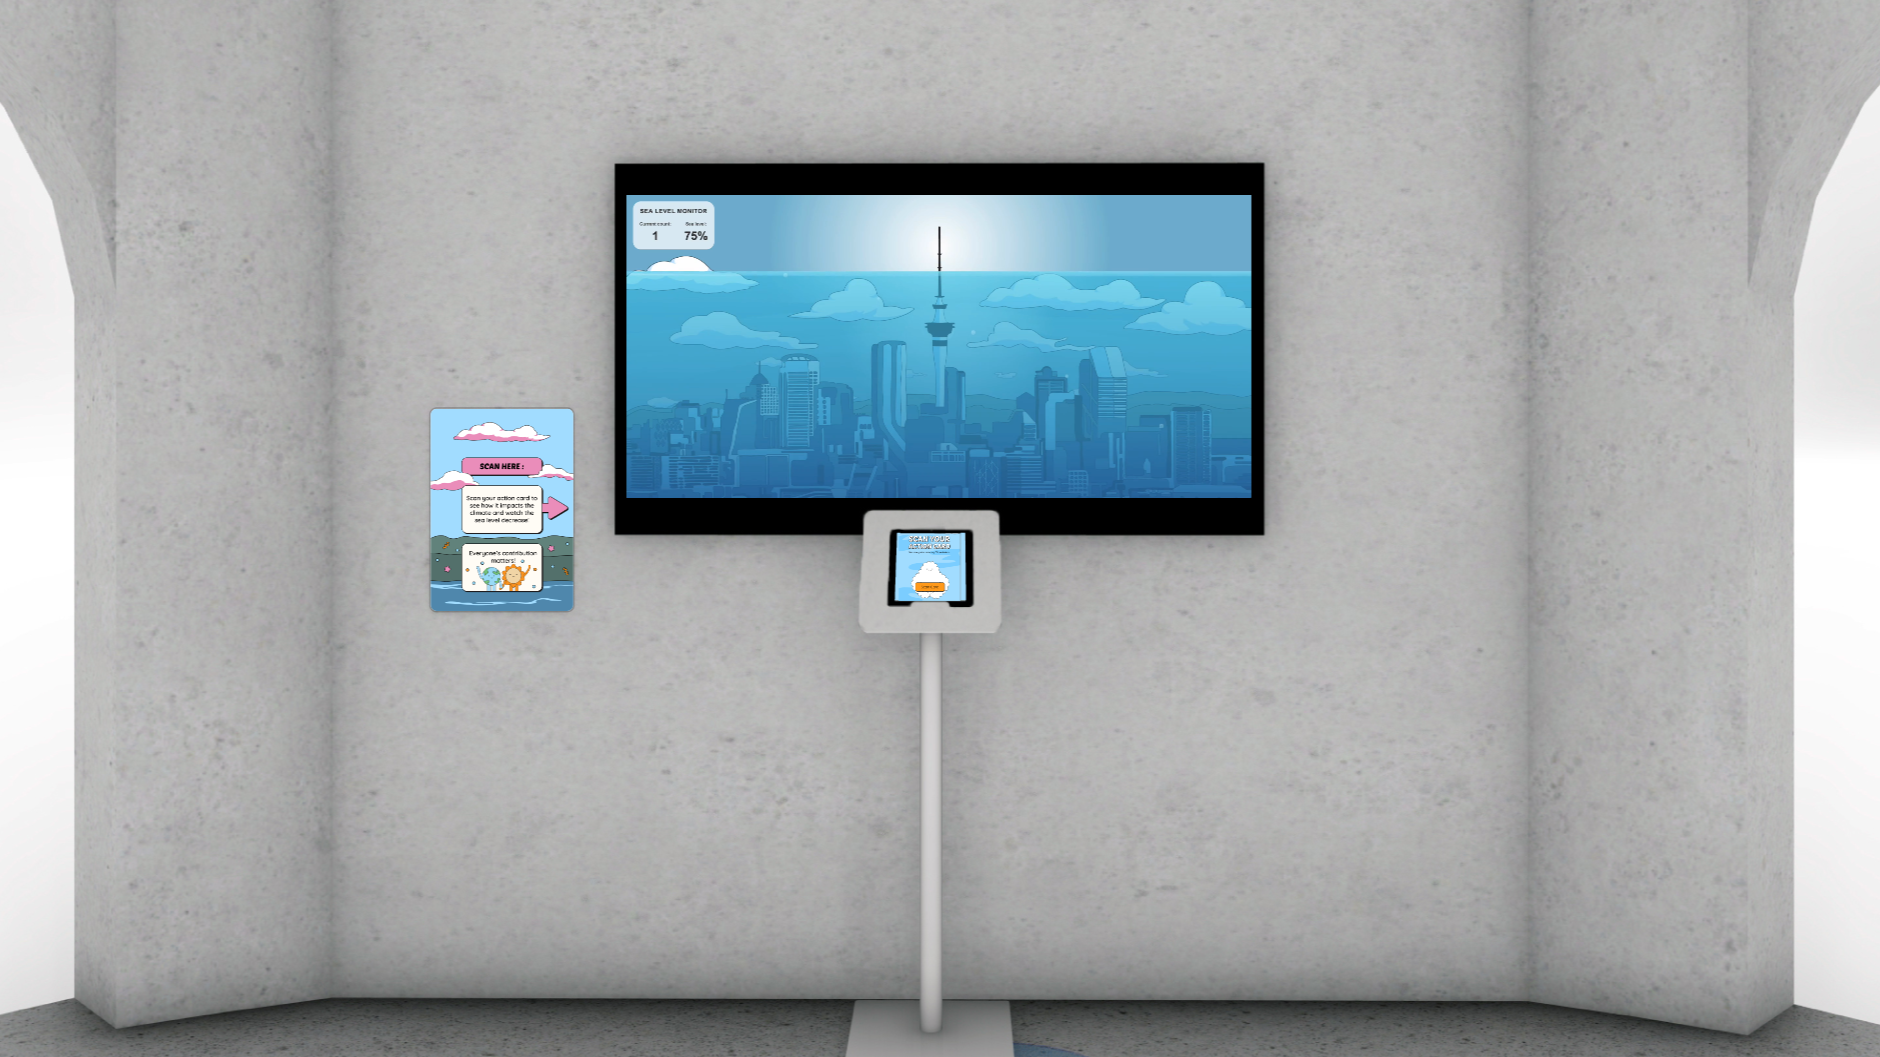
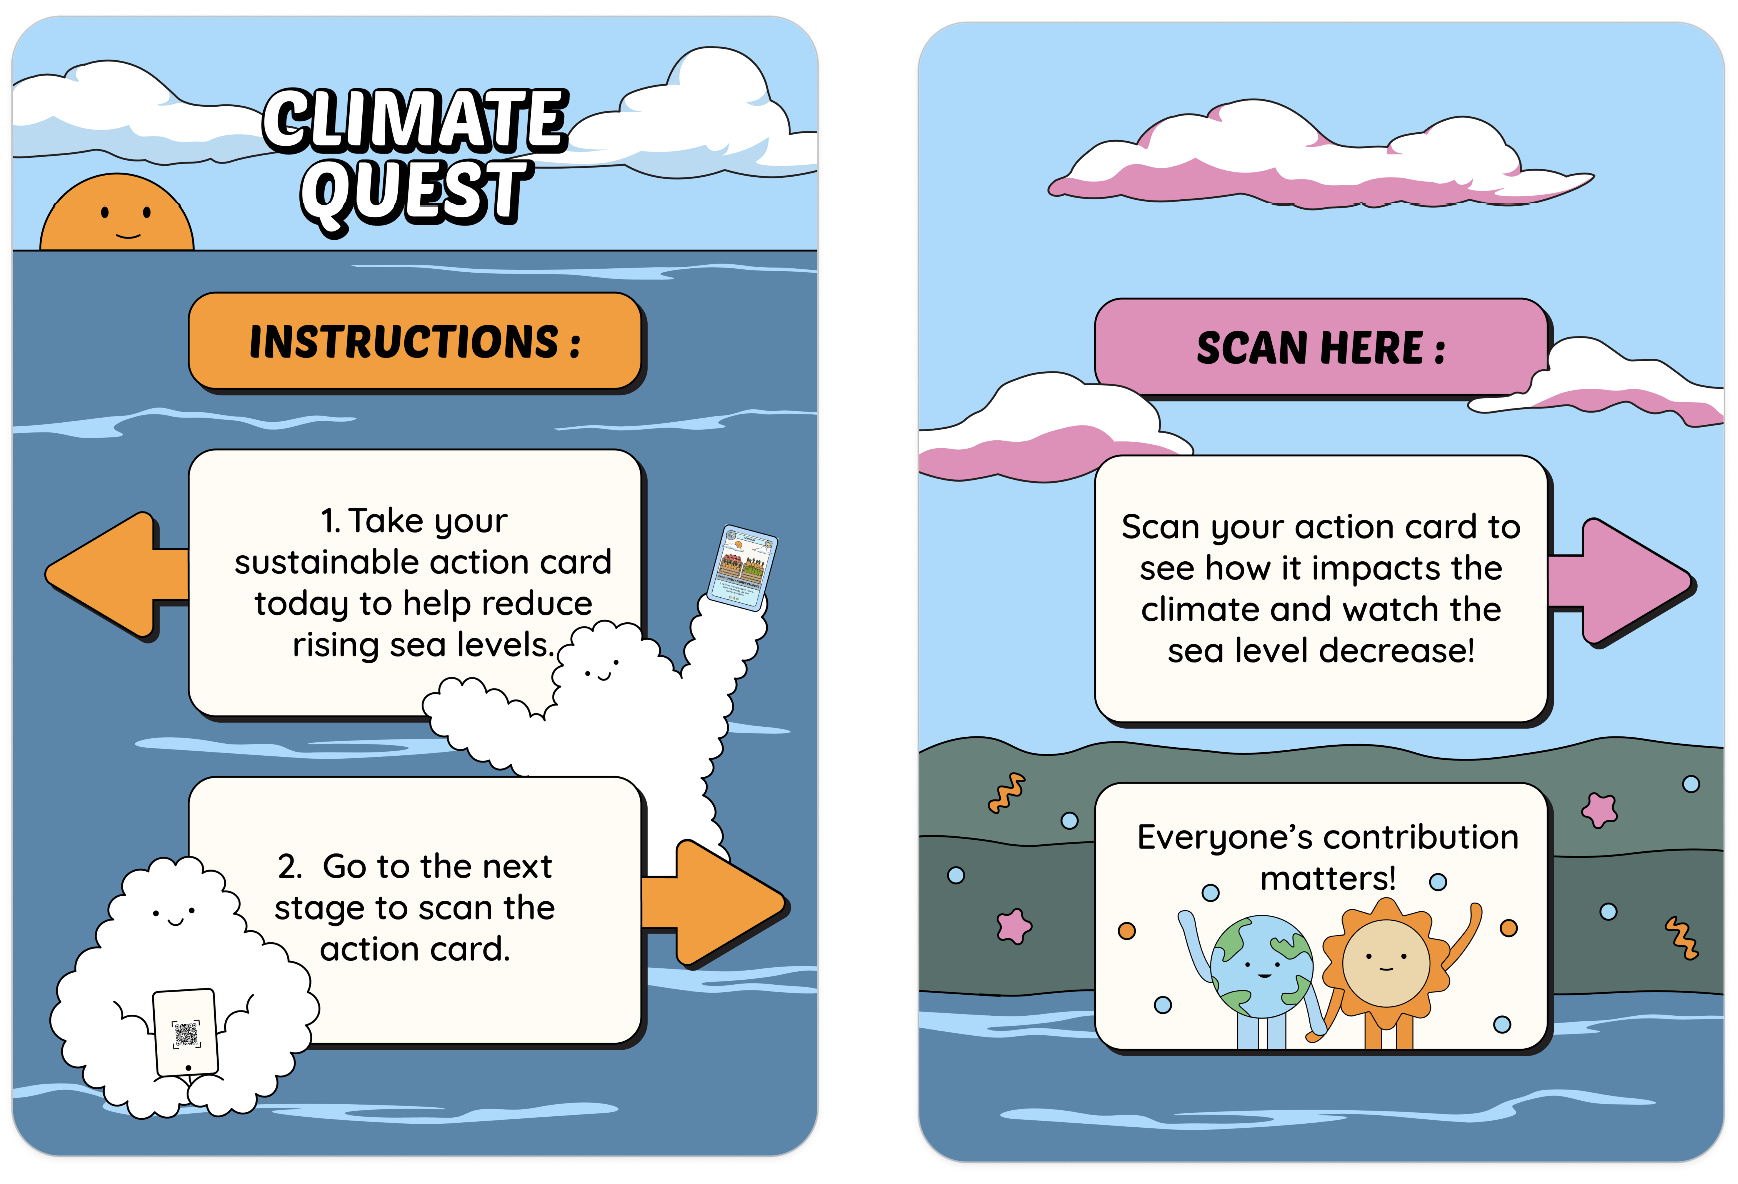
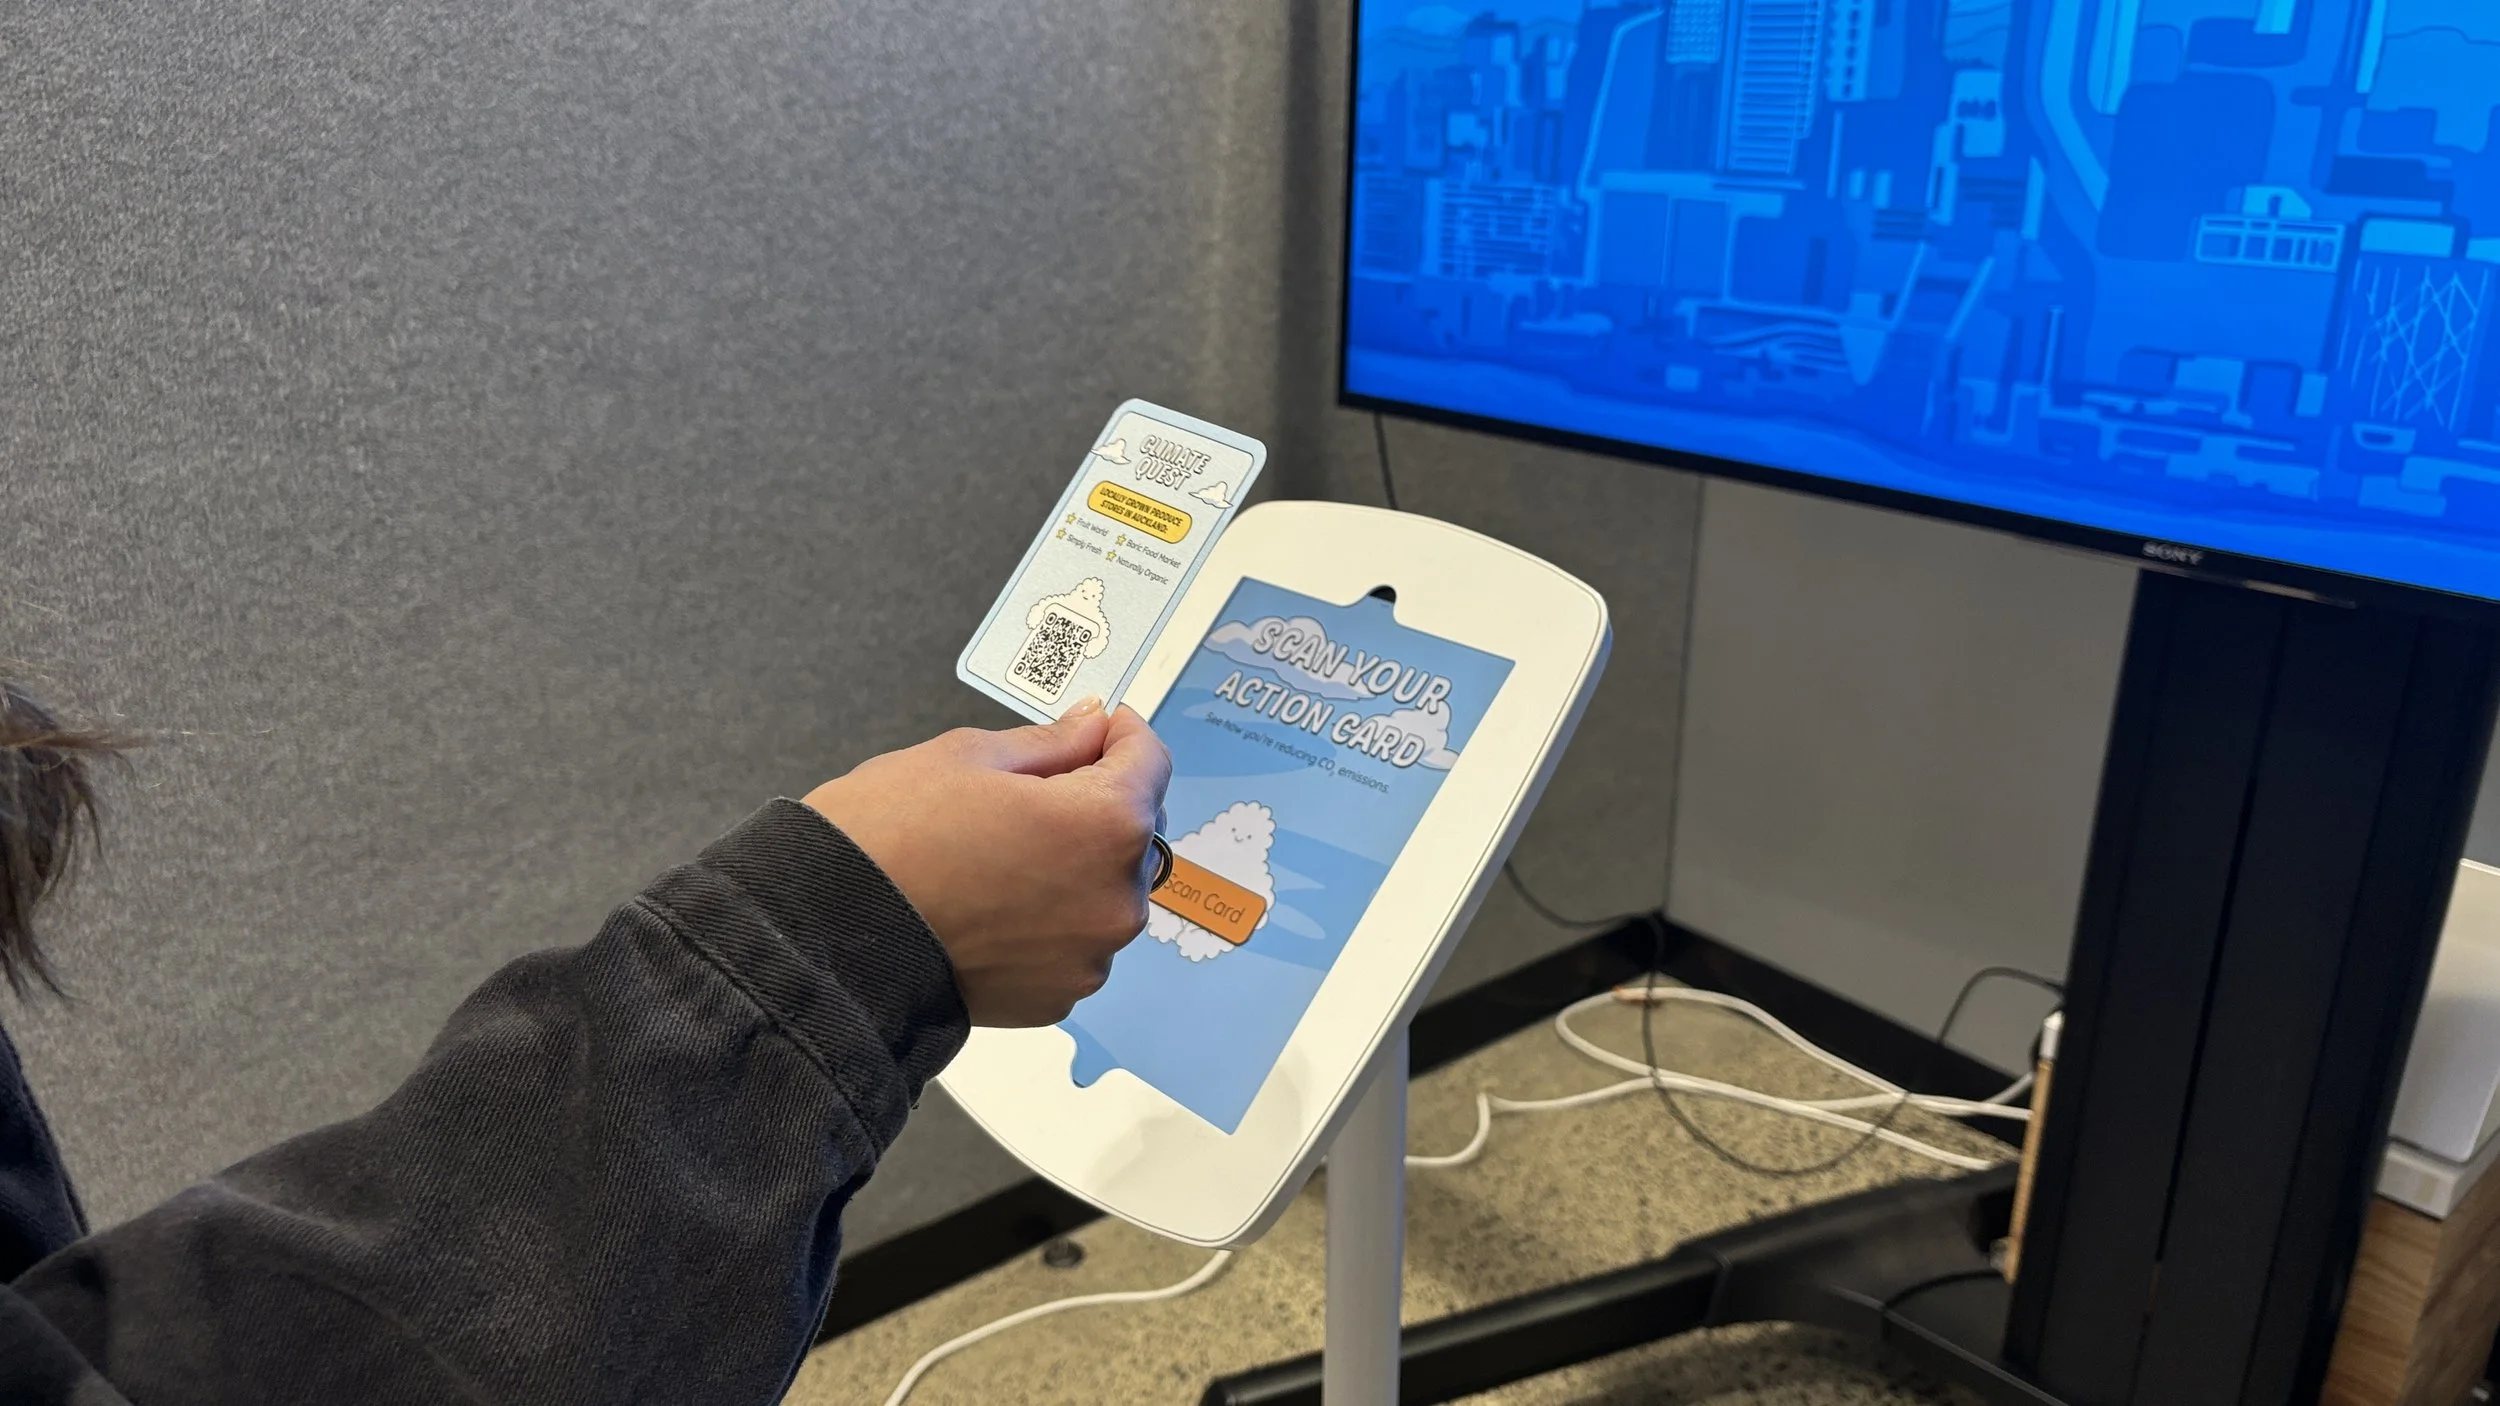
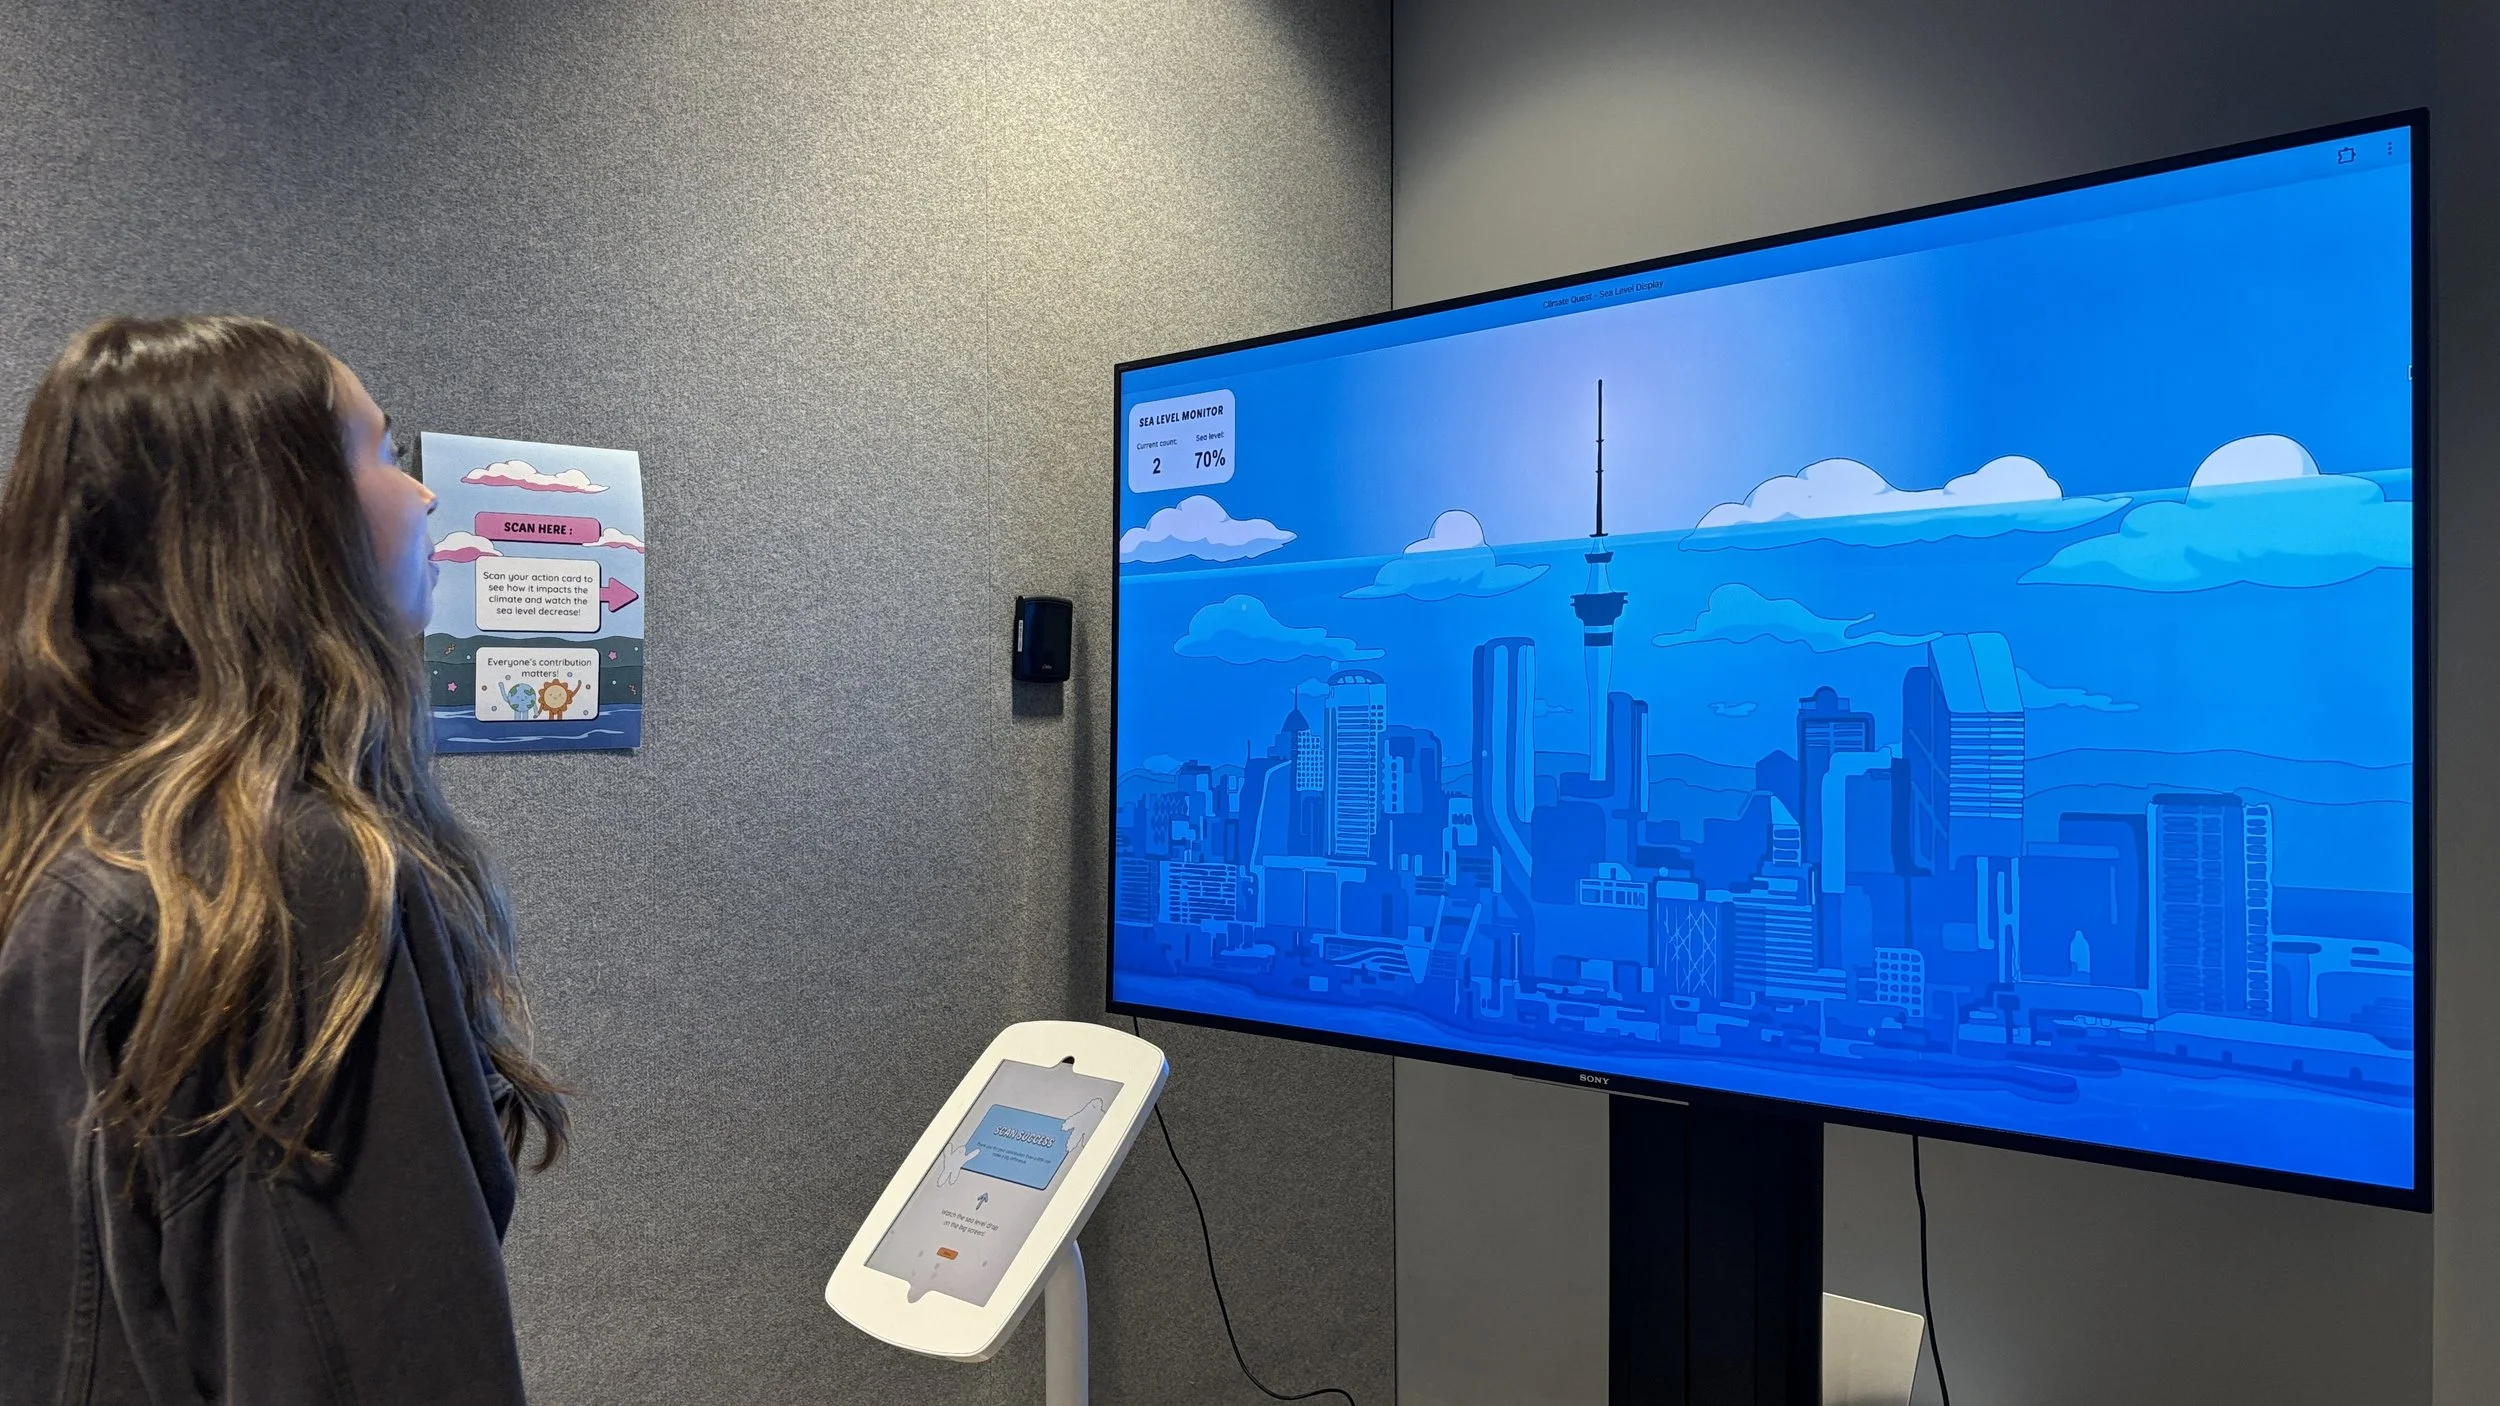
Empowerment wall, scan the action card to watch the sea level decrease.
-
Greenhouse gas emissions are steadily warming the atmosphere. The ocean absorbs about 90% of this excess heat, causing seawater to expand. Warmer waters also melt roughly 1.2 trillion tonnes of ice from both hemispheres each year, raising global sea levels by 3.6mm. In some parts of New Zealand, such as Christchurch, the land is gradually sinking due to the 2011 earthquakes. The combination of rising seas and sinking land makes sea level rise even worse.
Rising sea levels are already impacting Aotearoa. This is not a distant problem; it is happening now. Coastal areas in New Zealand are facing more frequent flooding and erosion, especially where the land is also sinking. The effects are not limited to the coast. As more land becomes uninhabitable, more people will be forced to move inland, increasing pressure on already strained cities, infrastructure, and communities.
Floods that once happened only once a century could soon become annual or even monthly events, especially when combined with king tides and storm surges. Despite the urgency and potentially catastrophic consequences, these warnings still feel distant to many people, particularly young urban New Zealanders.
All the data is available, but it is difficult to relate to something that seems so abstract. We realised that facts and numbers alone are not enough. People need to see and emotionally connect with the future to truly care. -
In this project, I particularly enjoyed the collaborative nature of working with my team. We were closely involved in each other’s contributions throughout the process, sharing ideas, providing feedback, iterating and refining the work together. This created a strong sense of teamwork and resulted in a more cohesive final outcome.
It was also my first time designing wayfinding for an exhibition, which I thoroughly enjoyed. It challenged me to think beyond aesthetically and consider how visual communication can guide visitors through a physical space and create a cohesive experience.
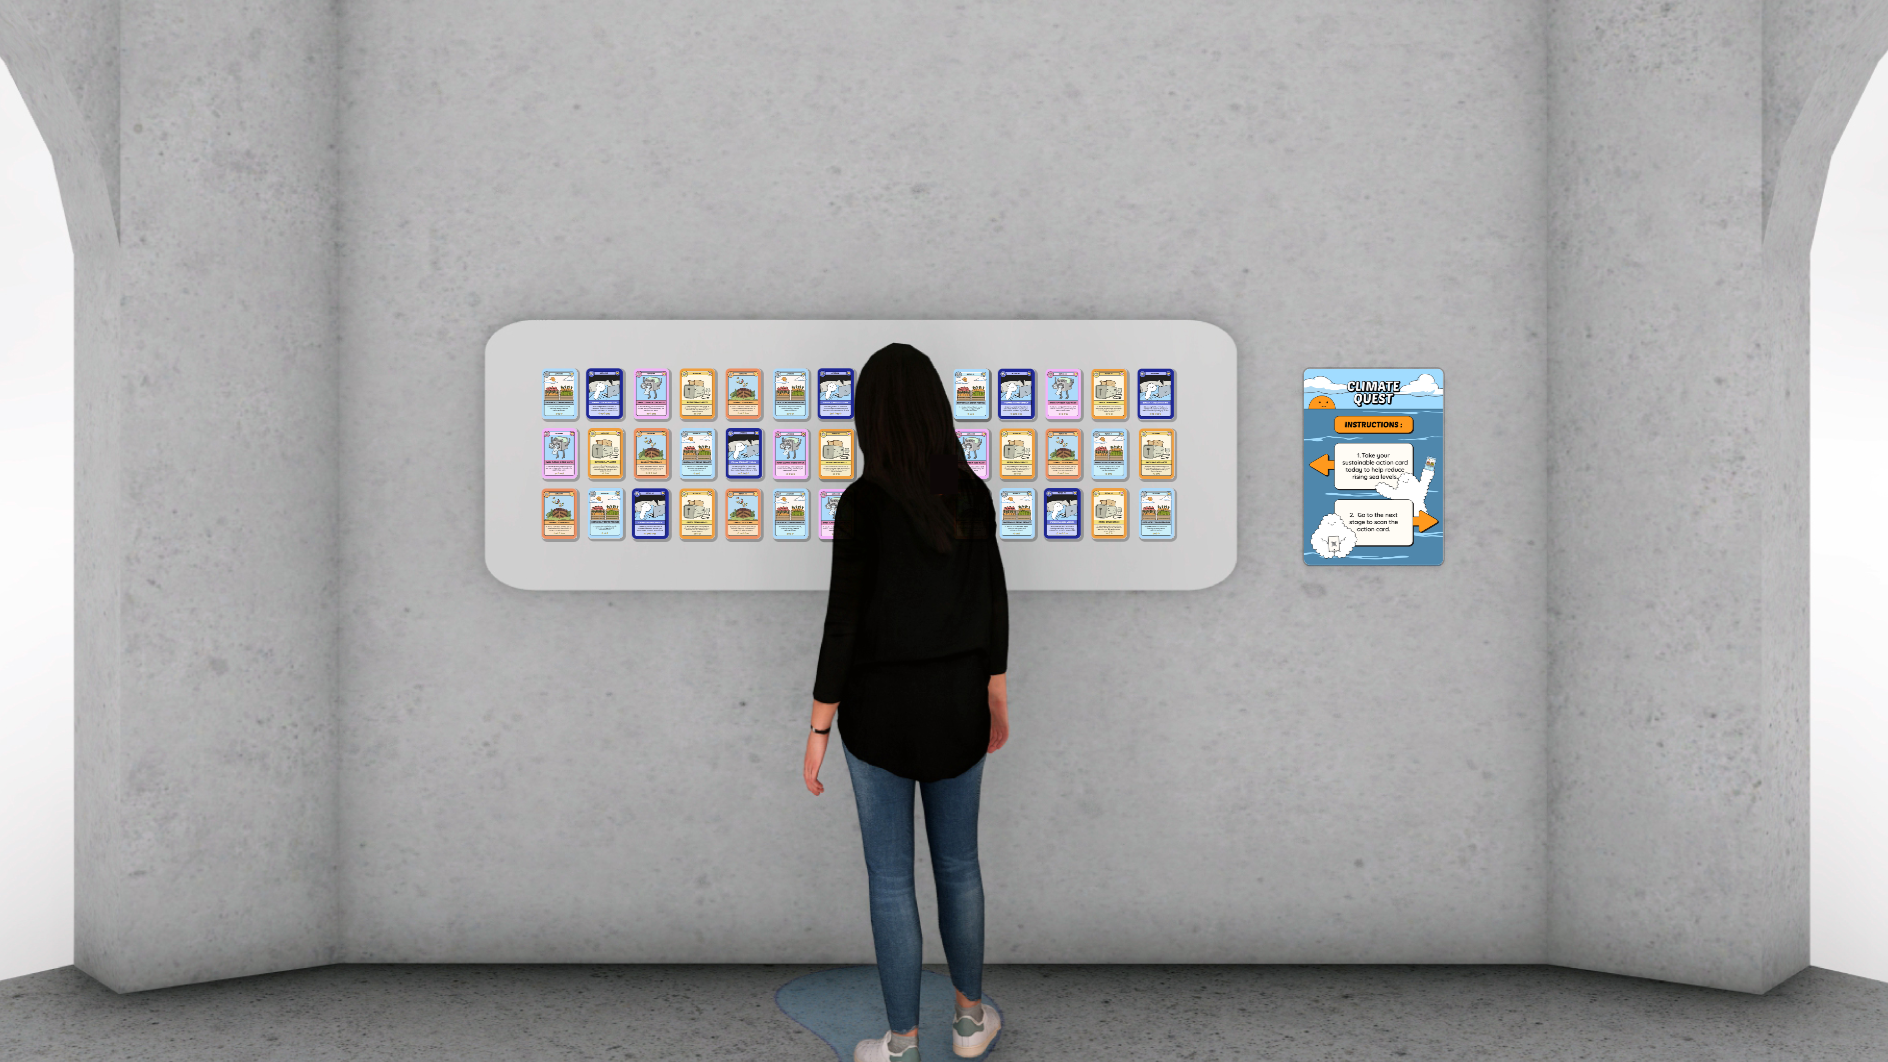
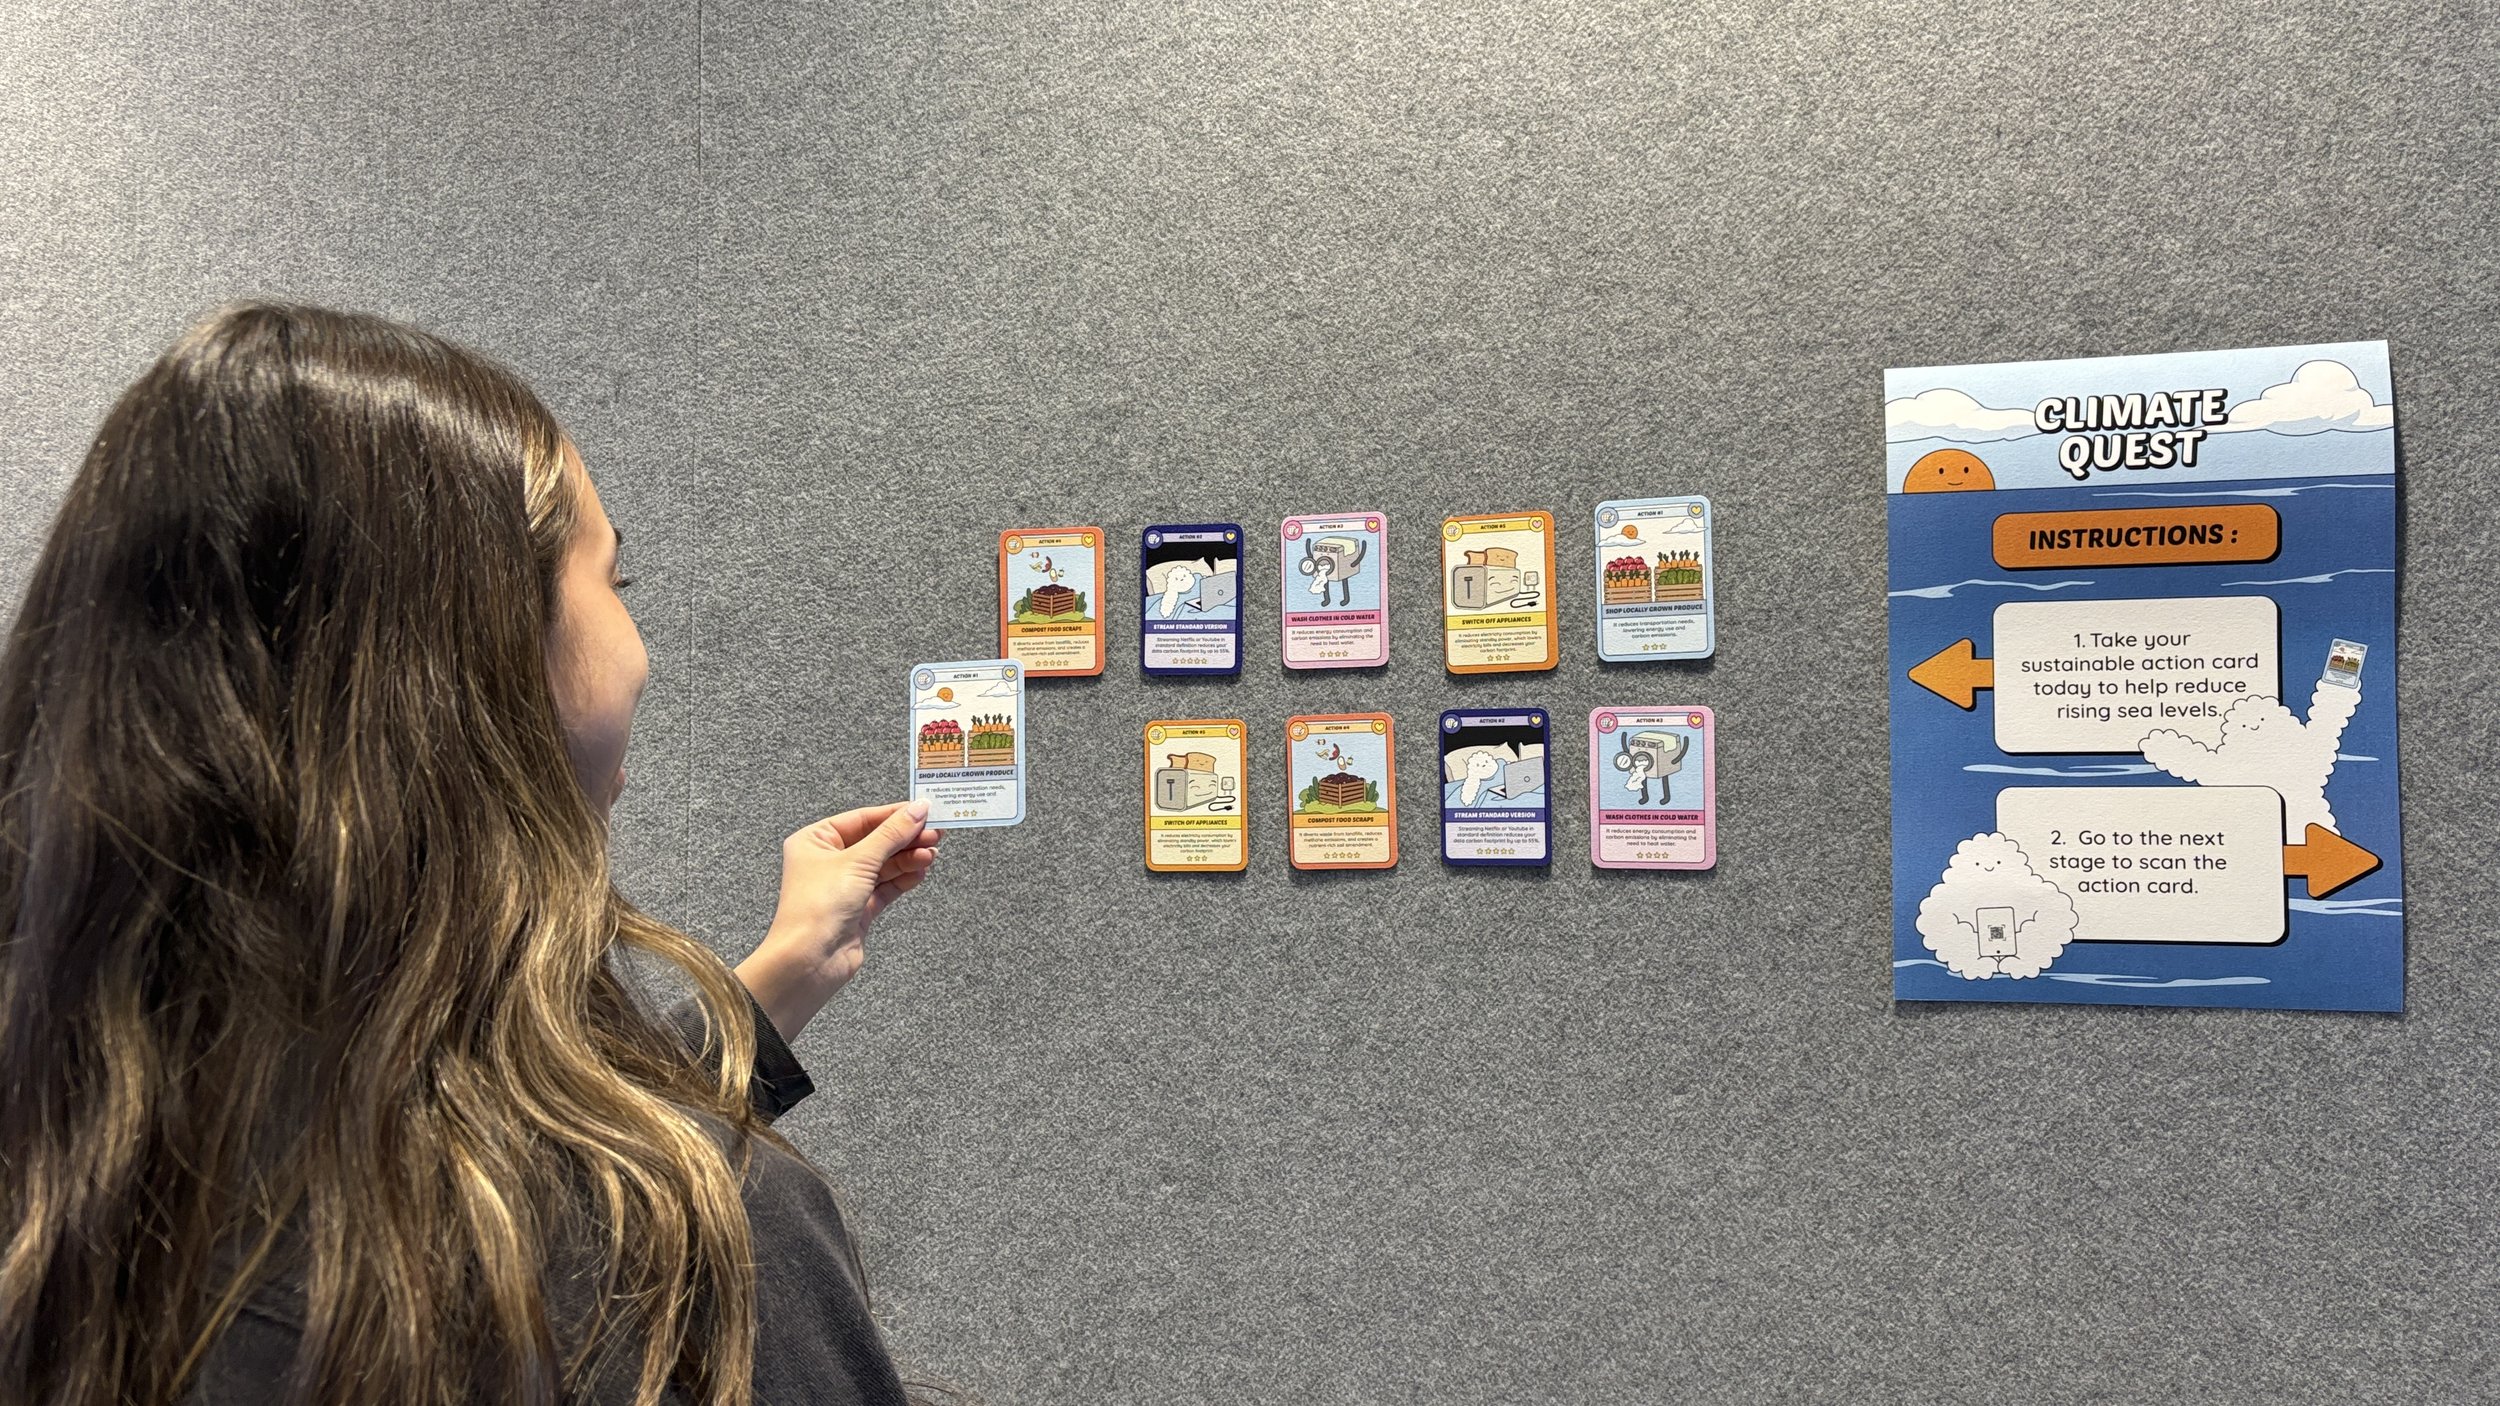
Action card wall, pick a card with a sustainability action that you resonate with.
Other Projects